
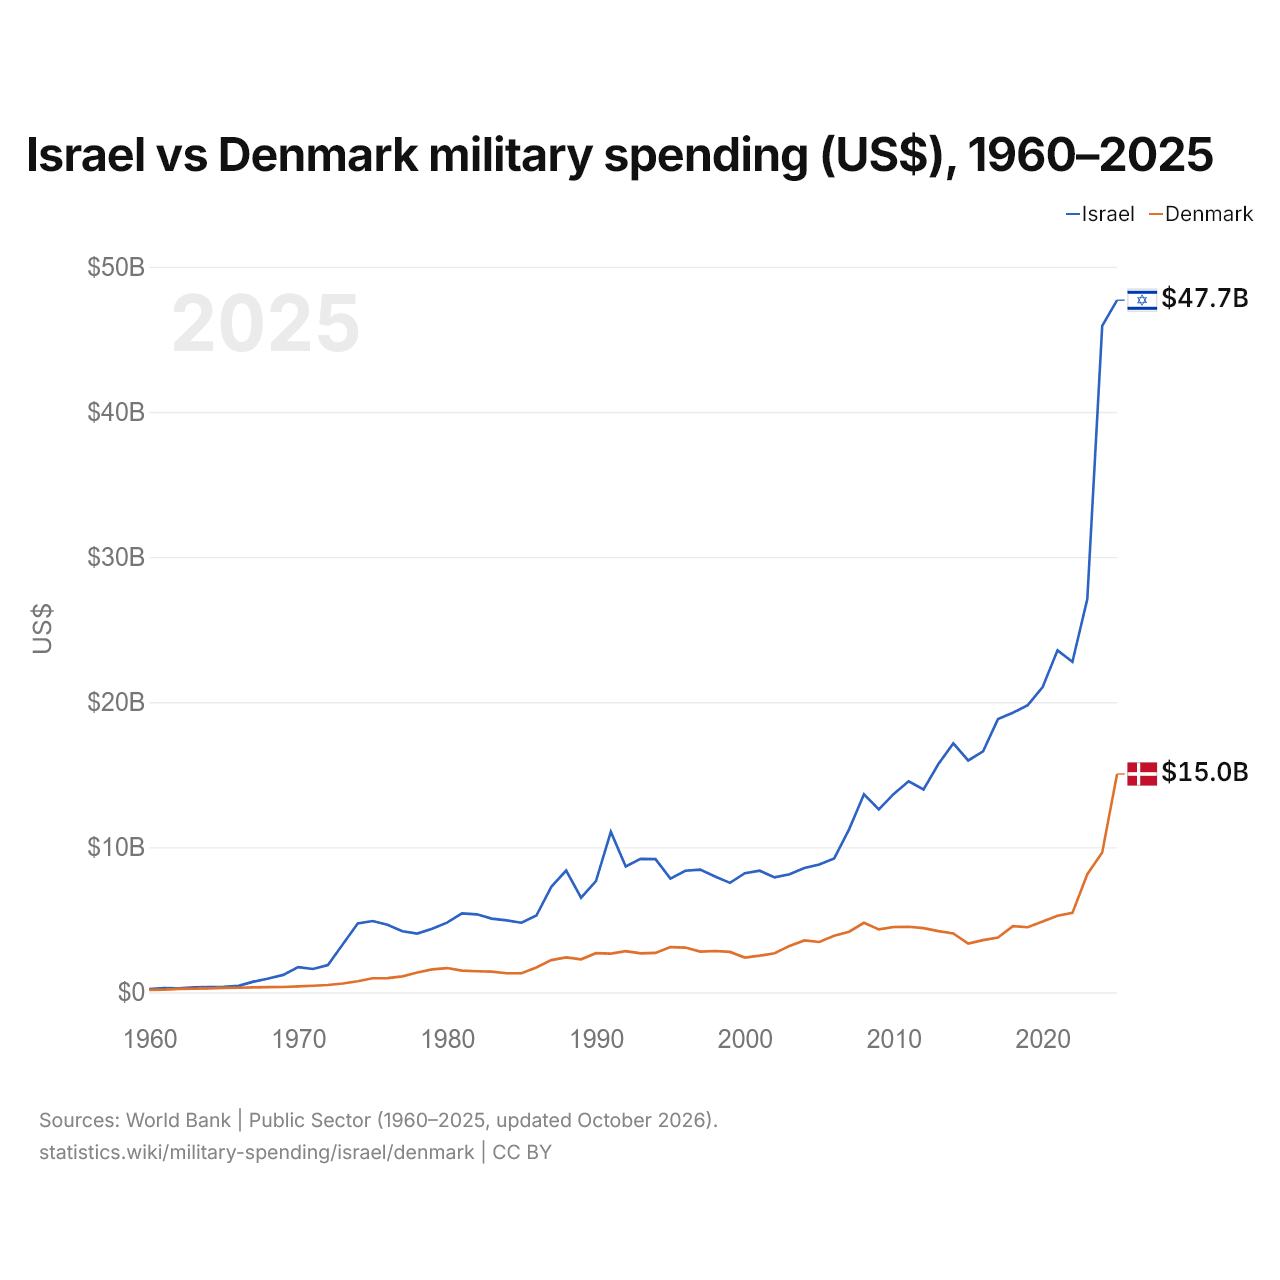
Israël vs Danemark : dépenses militaires ($ US), 1960–2025
| Année | $ US | |
|---|---|---|
 Israël |
 Danemark |
|
| 2025 | 47 696 033 185 $ US | 15 045 307 962 $ US |
| 2024 | 45 921 377 944 $ US | 9 630 891 141 $ US |
| 2023 | 27 102 879 898 $ US | 8 142 586 607 $ US |
| 2022 | 22 772 546 913 $ US | 5 472 748 572 $ US |
| 2021 | 23 566 015 120 $ US | 5 274 439 884 $ US |
| 2020 | 21 035 147 446 $ US | 4 885 548 211 $ US |
| 2019 | 19 793 980 550 $ US | 4 487 478 756 $ US |
| 2018 | 19 262 910 164 $ US | 4 558 786 678 $ US |
| 2017 | 18 828 969 647 $ US | 3 780 312 393 $ US |
| 2016 | 16 602 757 691 $ US | 3 593 436 189 $ US |
| 2015 | 15 975 634 696 $ US | 3 364 047 774 $ US |
| 2014 | 17 153 822 653 $ US | 4 056 861 511 $ US |
| 2013 | 15 737 032 127 $ US | 4 216 646 319 $ US |
| 2012 | 13 982 341 034 $ US | 4 422 461 491 $ US |
| 2011 | 14 547 222 878 $ US | 4 518 588 835 $ US |
| 2010 | 13 671 551 479 $ US | 4 503 496 131 $ US |
| 2009 | 12 608 502 172 $ US | 4 337 331 418 $ US |
| 2008 | 13 643 456 573 $ US | 4 788 058 296 $ US |
| 2007 | 11 229 545 538 $ US | 4 175 652 589 $ US |
| 2006 | 9 227 846 795 $ US | 3 896 717 562 $ US |
| 2005 | 8 812 760 099 $ US | 3 468 458 704 $ US |
| 2004 | 8 568 320 539 $ US | 3 578 808 566 $ US |
| 2003 | 8 134 330 828 $ US | 3 199 143 859 $ US |
| 2002 | 7 918 119 424 $ US | 2 694 085 906 $ US |
| 2001 | 8 381 500 855 $ US | 2 525 231 893 $ US |
| 2000 | 8 207 488 167 $ US | 2 392 522 671 $ US |
| 1999 | 7 542 229 863 $ US | 2 784 897 222 $ US |
| 1998 | 7 978 828 529 $ US | 2 846 078 080 $ US |
| 1997 | 8 456 766 318 $ US | 2 804 300 098 $ US |
| 1996 | 8 376 722 068 $ US | 3 086 208 978 $ US |
| 1995 | 7 831 373 985 $ US | 3 117 949 450 $ US |
| 1994 | 9 177 200 760 $ US | 2 718 768 670 $ US |
| 1993 | 9 196 309 022 $ US | 2 682 027 792 $ US |
| 1992 | 8 675 456 841 $ US | 2 837 759 481 $ US |
| 1991 | 11 059 734 636 $ US | 2 671 929 962 $ US |
| 1990 | 7 662 202 393 $ US | 2 696 292 300 $ US |
| 1989 | 6 522 947 452 $ US | 2 273 446 184 $ US |
| 1988 | 8 391 115 254 $ US | 2 411 867 529 $ US |
| 1987 | 7 270 945 603 $ US | 2 218 222 740 $ US |
| 1986 | 5 288 619 484 $ US | 1 706 553 505 $ US |
| 1985 | 4 795 577 076 $ US | 1 314 418 685 $ US |
| 1984 | 4 956 082 038 $ US | 1 315 996 832 $ US |
| 1983 | 5 076 928 419 $ US | 1 426 676 771 $ US |
| 1982 | 5 376 203 636 $ US | 1 453 974 927 $ US |
| 1981 | 5 443 543 755 $ US | 1 498 802 937 $ US |
| 1980 | 4 801 649 134 $ US | 1 673 336 248 $ US |
| 1979 | 4 380 124 292 $ US | 1 584 918 352 $ US |
| 1978 | 4 049 524 974 $ US | 1 370 364 571 $ US |
| 1977 | 4 212 457 725 $ US | 1 101 762 175 $ US |
| 1976 | 4 663 649 348 $ US | 980 949 933 $ US |
| 1975 | 4 914 361 654 $ US | 968 943 517 $ US |
| 1974 | 4 746 203 004 $ US | 762 656 414 $ US |
| 1973 | 3 313 546 062 $ US | 606 932 156 $ US |
| 1972 | 1 877 569 571 $ US | 506 422 361 $ US |
| 1971 | 1 606 973 896 $ US | 450 858 280 $ US |
| 1970 | 1 735 584 449 $ US | 414 783 353 $ US |
| 1969 | 1 201 475 189 $ US | 368 663 989 $ US |
| 1968 | 950 708 578 $ US | 361 400 270 $ US |
| 1967 | 734 978 433 $ US | 337 996 142 $ US |
| 1966 | 443 467 169 $ US | 314 610 126 $ US |
| 1965 | 370 736 979 $ US | 307 872 371 $ US |
| 1964 | 361 349 246 $ US | 275 120 243 $ US |
| 1963 | 344 668 589 $ US | 257 496 781 $ US |
| 1962 | 271 555 520 $ US | 240 051 552 $ US |
| 1961 | 291 500 933 $ US | 182 586 510 $ US |
| 1960 | 228 931 965 $ US | 173 588 446 $ US |
En 2025, les dépenses militaires s'élevaient à 47,7 milliards de dollars en Israël et à 15 milliards de dollars au Danemark : 3,2 fois plus en Israël. En 1960, elles s'élevaient à 229 millions de dollars en Israël et à 174 millions de dollars au Danemark, soit 32 % de plus en Israël.
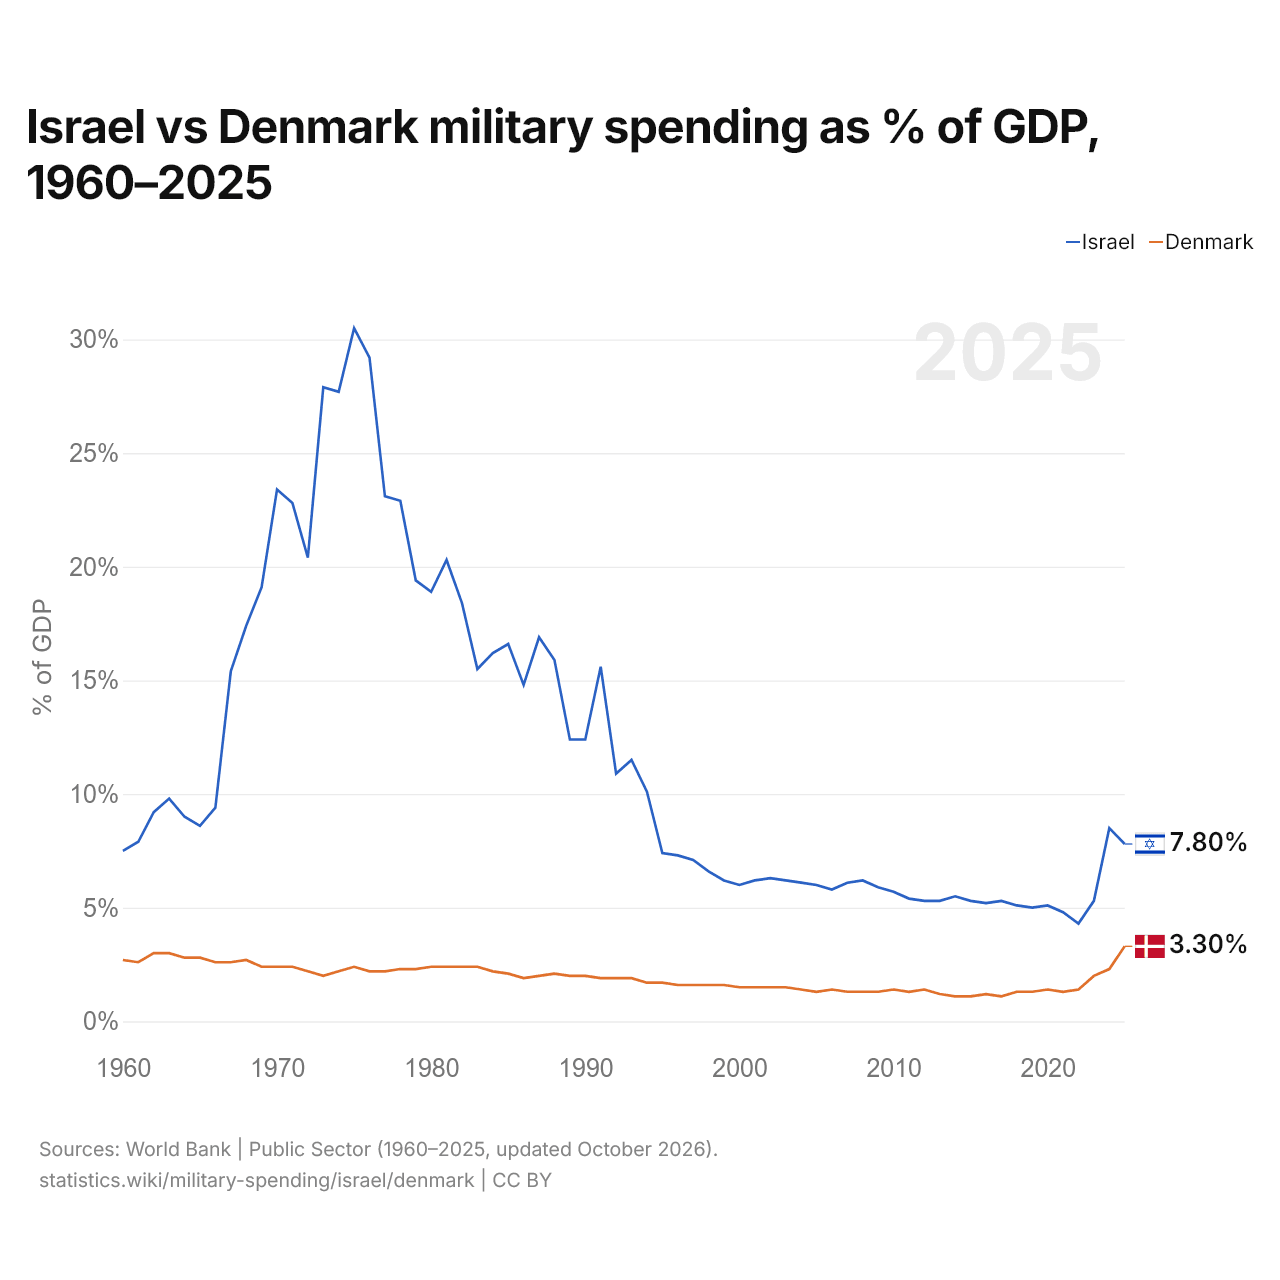
Israël vs Danemark : dépenses militaires en % du PIB, 1960–2025
| Année | % du PIB | |
|---|---|---|
|
Israël
|
Danemark
|
|
| 2025 | 7,8 % | 3,3 % |
| 2024 | 8,5 % | 2,3 % |
| 2023 | 5,3 % | 2 % |
| 2022 | 4,3 % | 1,4 % |
| 2021 | 4,8 % | 1,3 % |
| 2020 | 5,1 % | 1,4 % |
| 2019 | 5 % | 1,3 % |
| 2018 | 5,1 % | 1,3 % |
| 2017 | 5,3 % | 1,1 % |
| 2016 | 5,2 % | 1,2 % |
| 2015 | 5,3 % | 1,1 % |
| 2014 | 5,5 % | 1,1 % |
| 2013 | 5,3 % | 1,2 % |
| 2012 | 5,3 % | 1,4 % |
| 2011 | 5,4 % | 1,3 % |
| 2010 | 5,7 % | 1,4 % |
| 2009 | 5,9 % | 1,3 % |
| 2008 | 6,2 % | 1,3 % |
| 2007 | 6,1 % | 1,3 % |
| 2006 | 5,8 % | 1,4 % |
| 2005 | 6 % | 1,3 % |
| 2004 | 6,1 % | 1,4 % |
| 2003 | 6,2 % | 1,5 % |
| 2002 | 6,3 % | 1,5 % |
| 2001 | 6,2 % | 1,5 % |
| 2000 | 6 % | 1,5 % |
| 1999 | 6,2 % | 1,6 % |
| 1998 | 6,6 % | 1,6 % |
| 1997 | 7,1 % | 1,6 % |
| 1996 | 7,3 % | 1,6 % |
| 1995 | 7,4 % | 1,7 % |
| 1994 | 10,1 % | 1,7 % |
| 1993 | 11,5 % | 1,9 % |
| 1992 | 10,9 % | 1,9 % |
| 1991 | 15,6 % | 1,9 % |
| 1990 | 12,4 % | 2 % |
| 1989 | 12,4 % | 2 % |
| 1988 | 15,9 % | 2,1 % |
| 1987 | 16,9 % | 2 % |
| 1986 | 14,8 % | 1,9 % |
| 1985 | 16,6 % | 2,1 % |
| 1984 | 16,2 % | 2,2 % |
| 1983 | 15,5 % | 2,4 % |
| 1982 | 18,4 % | 2,4 % |
| 1981 | 20,3 % | 2,4 % |
| 1980 | 18,9 % | 2,4 % |
| 1979 | 19,4 % | 2,3 % |
| 1978 | 22,9 % | 2,3 % |
| 1977 | 23,1 % | 2,2 % |
| 1976 | 29,2 % | 2,2 % |
| 1975 | 30,5 % | 2,4 % |
| 1974 | 27,7 % | 2,2 % |
| 1973 | 27,9 % | 2 % |
| 1972 | 20,4 % | 2,2 % |
| 1971 | 22,8 % | 2,4 % |
| 1970 | 23,4 % | 2,4 % |
| 1969 | 19,1 % | 2,4 % |
| 1968 | 17,4 % | 2,7 % |
| 1967 | 15,4 % | 2,6 % |
| 1966 | 9,4 % | 2,6 % |
| 1965 | 8,6 % | 2,8 % |
| 1964 | 9 % | 2,8 % |
| 1963 | 9,8 % | 3 % |
| 1962 | 9,2 % | 3 % |
| 1961 | 7,9 % | 2,6 % |
| 1960 | 7,5 % | 2,7 % |
En 2025, les dépenses militaires représentaient 7,8 % du PIB en Israël et 3,3 % au Danemark : 4,5 points de pourcentage de plus en Israël. En 2015, elles représentaient 5,3 % en Israël et 1,1 % au Danemark, soit 4,2 points de pourcentage de plus en Israël.
Les dépenses militaires d'Israël, en part du PIB, sont supérieures à celles du Danemark chaque année depuis 1960. L'écart a été le plus grand en 1975, quand les dépenses militaires d'Israël dépassaient celles du Danemark de 28,1 points de pourcentage du PIB.
Israël vs Danemark : chiffres des dépenses militaires
|
Israël
|
Danemark
|
|
|---|---|---|
| $ US, 2025 | 47,7 Md $US | 15,0 Md $US |
| % du PIB, 2025 | 7,8 % | 3,3 % |
| Par personne, $ US | 4 712 $US | 2 504 $US |
| Part mondiale | 1,67 % | 0,53 % |
| Rang mondial | 13/154 | 27/154 |
Comparer les dépenses militaires de 2 pays au choix
Sources :
- Banque mondiale | Secteur public (1960–2025, mis à jour en octobre 2026)
Creative Commons Attribution (CC BY) : vous pouvez copier, partager, adapter et réutiliser ce contenu, y compris à des fins commerciales, à condition de citer statistics.wiki et d’indiquer les modifications apportées. Les sources citées ci-dessus peuvent avoir leurs propres conditions de licence.