
Égypte vs Argentine : dépenses militaires ($ US), 1960–2025
| Année | $ US | |
|---|---|---|
 Égypte |
 Argentine |
|
| 2025 | 2 211 909 781 $ US | 3 847 030 490 $ US |
| 2024 | 2 594 131 539 $ US | 4 179 838 658 $ US |
| 2023 | 3 202 720 058 $ US | 4 882 352 994 $ US |
| 2022 | 4 837 825 933 $ US | 4 340 235 091 $ US |
| 2021 | 4 764 856 581 $ US | 3 074 056 518 $ US |
| 2020 | 4 308 261 249 $ US | 2 831 765 795 $ US |
| 2019 | 3 763 506 933 $ US | 3 132 922 213 $ US |
| 2018 | 3 282 269 142 $ US | 3 843 257 896 $ US |
| 2017 | 3 531 797 346 $ US | 5 456 390 671 $ US |
| 2016 | 5 540 490 797 $ US | 4 511 804 451 $ US |
| 2015 | 5 675 471 698 $ US | 5 056 133 759 $ US |
| 2014 | 5 163 629 842 $ US | 4 621 617 919 $ US |
| 2013 | 4 643 953 488 $ US | 4 624 515 687 $ US |
| 2012 | 4 600 333 333 $ US | 4 285 004 735 $ US |
| 2011 | 4 335 190 497 $ US | 4 051 930 111 $ US |
| 2010 | 4 276 678 847 $ US | 3 452 047 165 $ US |
| 2009 | 3 844 687 230 $ US | 2 951 865 094 $ US |
| 2008 | 3 550 715 277 $ US | 2 757 807 340 $ US |
| 2007 | 3 103 943 793 $ US | 2 278 817 797 $ US |
| 2006 | 2 799 758 662 $ US | 1 833 095 114 $ US |
| 2005 | 2 433 579 236 $ US | 1 683 610 808 $ US |
| 2004 | 2 266 990 112 $ US | 1 454 415 858 $ US |
| 2003 | 2 550 993 462 $ US | 1 353 563 895 $ US |
| 2002 | 2 791 475 331 $ US | 1 067 029 325 $ US |
| 2001 | 2 886 586 099 $ US | 3 181 997 039 $ US |
| 2000 | 2 547 145 968 $ US | 3 264 997 128 $ US |
| 1999 | 2 331 054 191 $ US | 3 460 000 000 $ US |
| 1998 | 2 255 923 134 $ US | 3 397 002 841 $ US |
| 1997 | 2 228 763 775 $ US | 3 339 000 000 $ US |
| 1996 | 2 011 856 848 $ US | 3 377 996 897 $ US |
| 1995 | 1 854 129 731 $ US | 3 800 996 317 $ US |
| 1994 | 1 636 828 481 $ US | 3 751 000 000 $ US |
| 1993 | 1 442 883 497 $ US | 3 368 367 988 $ US |
| 1992 | 1 345 879 511 $ US | 3 251 456 838 $ US |
| 1991 | 1 350 353 204 $ US | 2 858 940 824 $ US |
| 1990 | 1 490 379 612 $ US | 2 050 898 683 $ US |
| 1989 | 1 577 569 288 $ US | 1 440 919 053 $ US |
| 1988 | 1 770 300 965 $ US | 2 696 340 375 $ US |
| 1987 | 2 641 243 148 $ US | 2 485 661 588 $ US |
| 1986 | 3 093 241 889 $ US | 2 449 546 586 $ US |
| 1985 | 3 068 407 529 $ US | 2 027 221 261 $ US |
| 1984 | 2 807 797 607 $ US | 2 527 749 192 $ US |
| 1983 | 2 464 502 056 $ US | 2 847 793 071 $ US |
| 1982 | 1 988 119 450 $ US | 2 280 144 825 $ US |
| 1981 | 1 641 813 127 $ US | 2 726 425 231 $ US |
| 1980 | 1 334 933 581 $ US | 2 385 017 949 $ US |
| 1979 | 1 165 739 571 $ US | 3 236 408 047 $ US |
| 1978 | 1 472 389 063 $ US | 4 202 371 974 $ US |
| 1977 | 1 888 242 217 $ US | 2 276 123 224 $ US |
| 1976 | 1 827 871 851 $ US | 1 934 867 782 $ US |
| 1975 | 1 795 059 940 $ US | 1 070 775 188 $ US |
| 1974 | 1 594 233 581 $ US | 1 201 859 183 $ US |
| 1973 | 1 364 666 840 $ US | 971 313 374 $ US |
| 1972 | 1 261 452 221 $ US | 633 463 772 $ US |
| 1971 | 1 479 678 577 $ US | 601 838 599 $ US |
| 1970 | 1 285 777 588 $ US | 593 081 284 $ US |
| 1969 | 935 349 383 $ US | 605 590 513 $ US |
| 1968 | 660 439 212 $ US | 445 649 879 $ US |
| 1967 | 499 319 641 $ US | 339 593 346 $ US |
| 1966 | 460 150 718 $ US | 334 403 945 $ US |
| 1965 | 500 678 197 $ US | 303 288 354 $ US |
| 1964 | 486 389 260 $ US | 294 460 368 $ US |
| 1963 | 362 803 175 $ US | 306 971 678 $ US |
| 1962 | 269 386 427 $ US | 487 782 584 $ US |
| 1961 | - | 430 829 516 $ US |
| 1960 | - | 245 914 852 $ US |
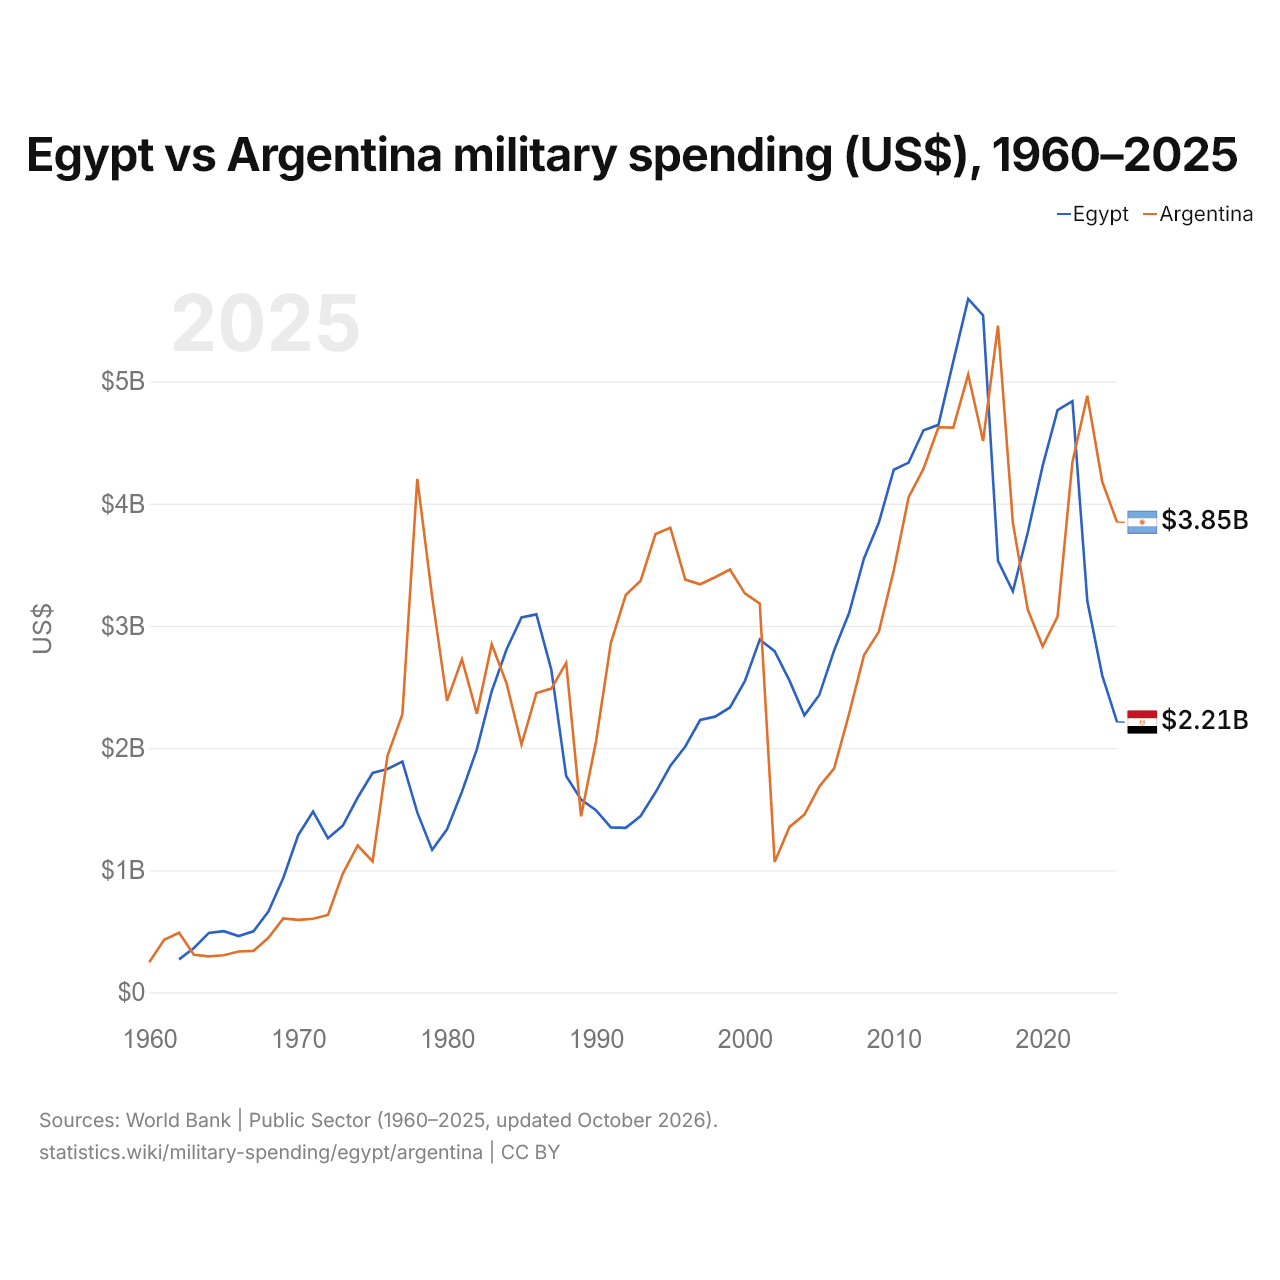
En 2025, les dépenses militaires s'élevaient à 2,21 milliards de dollars en Égypte et à 3,85 milliards de dollars en Argentine : 1,7 fois plus en Argentine. En 1962, elles s'élevaient à 269 millions de dollars en Égypte et à 488 millions de dollars en Argentine, soit 1,8 fois plus en Argentine.
Égypte vs Argentine : dépenses militaires en % du PIB, 1960–2025
| Année | % du PIB | |
|---|---|---|
|
Égypte
|
Argentine
|
|
| 2025 | 0,6 % | 0,6 % |
| 2024 | 0,7 % | 0,7 % |
| 2023 | 0,8 % | 0,8 % |
| 2022 | 1 % | 0,7 % |
| 2021 | 1,1 % | 0,6 % |
| 2020 | 1,1 % | 0,7 % |
| 2019 | 1,2 % | 0,7 % |
| 2018 | 1,2 % | 0,7 % |
| 2017 | 1,4 % | 0,8 % |
| 2016 | 1,7 % | 0,8 % |
| 2015 | 1,7 % | 0,9 % |
| 2014 | 1,7 % | 0,9 % |
| 2013 | 1,6 % | 0,8 % |
| 2012 | 1,6 % | 0,8 % |
| 2011 | 1,8 % | 0,8 % |
| 2010 | 2 % | 0,8 % |
| 2009 | 2 % | 0,9 % |
| 2008 | 2,2 % | 0,8 % |
| 2007 | 2,4 % | 0,8 % |
| 2006 | 2,6 % | 0,8 % |
| 2005 | 2,7 % | 0,8 % |
| 2004 | 2,9 % | 0,9 % |
| 2003 | 3,2 % | 1,1 % |
| 2002 | 3,3 % | 1,1 % |
| 2001 | 3 % | 1,2 % |
| 2000 | 2,6 % | 1,1 % |
| 1999 | 2,6 % | 1,2 % |
| 1998 | 2,7 % | 1,1 % |
| 1997 | 2,8 % | 1,1 % |
| 1996 | 3 % | 1,2 % |
| 1995 | 3,1 % | 1,5 % |
| 1994 | 3,2 % | 1,5 % |
| 1993 | 3,1 % | 1,4 % |
| 1992 | 3,2 % | 1,4 % |
| 1991 | 3,6 % | 1,5 % |
| 1990 | 3,5 % | 1,5 % |
| 1989 | 4 % | 1,9 % |
| 1988 | 5,1 % | 2,1 % |
| 1987 | 6,5 % | 2,3 % |
| 1986 | 7,5 % | 2,3 % |
| 1985 | 7,9 % | 2,3 % |
| 1984 | 8,3 % | 2,2 % |
| 1983 | 8 % | 2,7 % |
| 1982 | 7,2 % | 2,7 % |
| 1981 | 7,4 % | 3,5 % |
| 1980 | 6,2 % | 3,1 % |
| 1979 | 6,5 % | 4,7 % |
| 1978 | 9,9 % | 4,7 % |
| 1977 | 13,1 % | 4 % |
| 1976 | 13,7 % | 3,8 % |
| 1975 | 15,4 % | 2 % |
| 1974 | 17,3 % | 1,7 % |
| 1973 | 13,5 % | 1,8 % |
| 1972 | 13,6 % | 1,8 % |
| 1971 | 17,2 % | 1,8 % |
| 1970 | 16 % | 1,9 % |
| 1969 | 14,3 % | 1,9 % |
| 1968 | 11,1 % | 1,7 % |
| 1967 | 8,9 % | 1,4 % |
| 1966 | 8,7 % | 1,2 % |
| 1965 | 10,1 % | 1,1 % |
| 1964 | 10,3 % | 1,2 % |
| 1963 | 8,7 % | 1,7 % |
| 1962 | 6,7 % | 2,7 % |
| 1961 | - | 2,1 % |
| 1960 | - | 1,6 % |
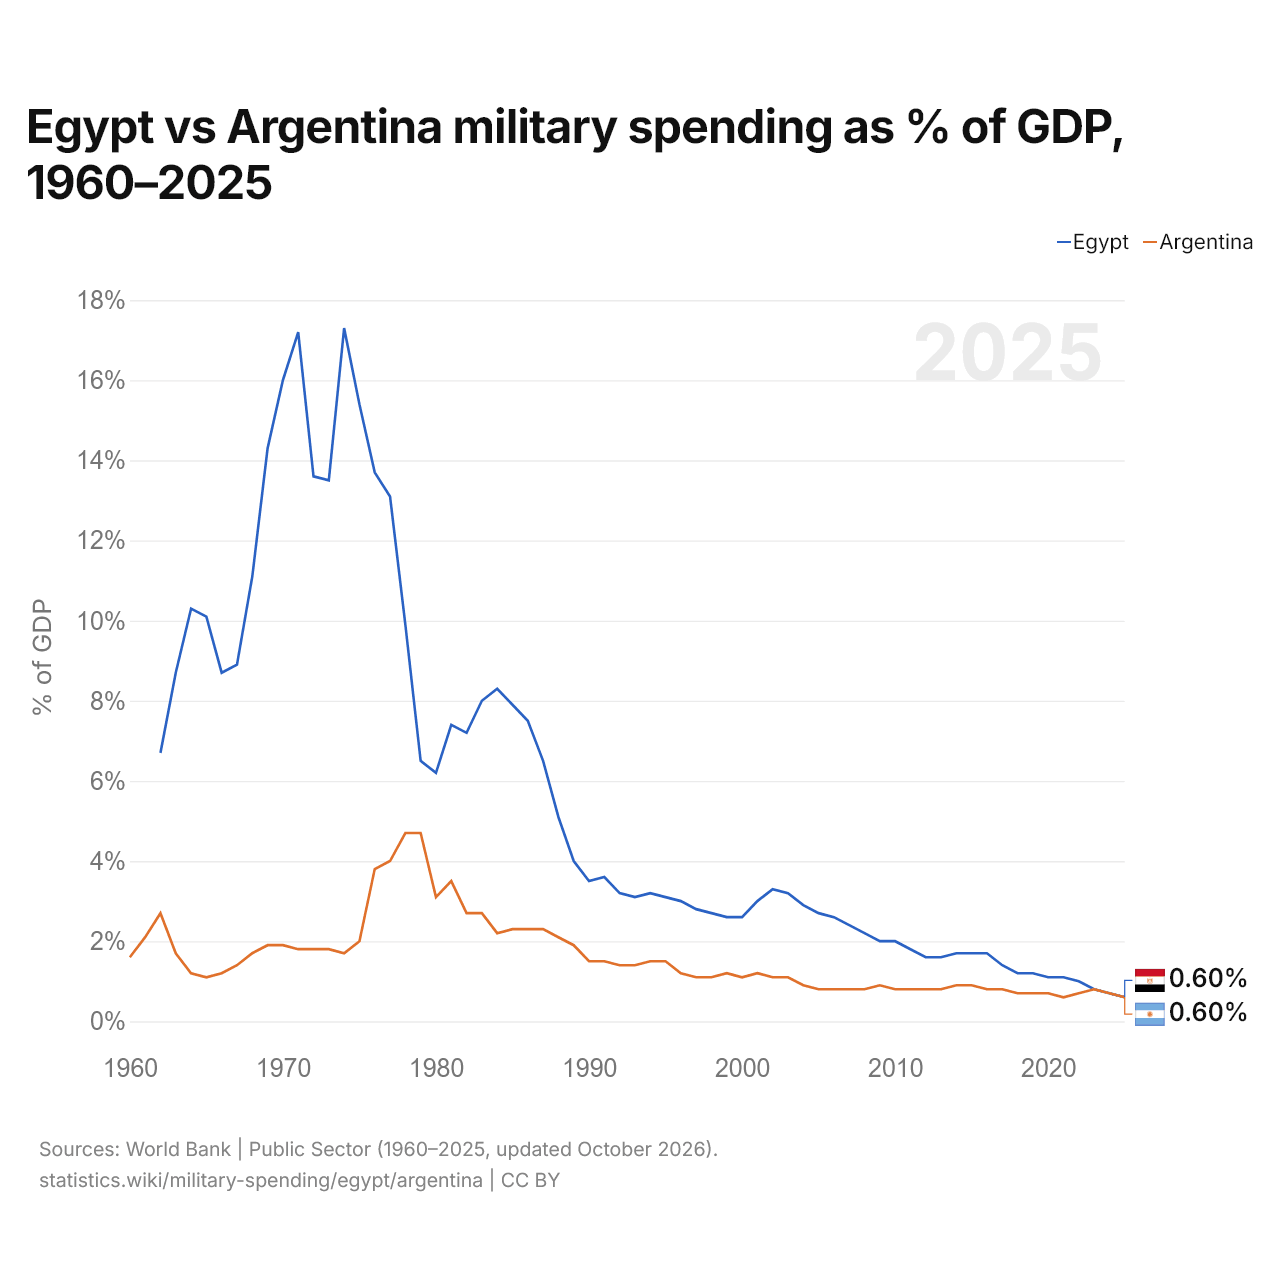
En 2025, les dépenses militaires représentaient 0,6 % du PIB en Égypte et 0,6 % en Argentine. En 2015, elles représentaient 1,7 % en Égypte et 0,9 % en Argentine, soit 0,8 points de pourcentage de plus en Égypte.
L'écart a été le plus grand en 1974, quand les dépenses militaires de l'Égypte dépassaient celles de l'Argentine de 15,6 points de pourcentage du PIB.
Égypte vs Argentine : chiffres des dépenses militaires
|
Égypte
|
Argentine
|
|
|---|---|---|
| $ US, 2025 | 2,21 Md $US | 3,85 Md $US |
| % du PIB, 2025 | 0,6 % | 0,6 % |
| Par personne, $ US | 18,7 $US | 83,9 $US |
| Part mondiale | 0,08 % | 0,13 % |
| Rang mondial | 65/154 | 52/154 |
Comparer les dépenses militaires de 2 pays au choix
Sources :
- Banque mondiale | Secteur public (1960–2025, mis à jour en octobre 2026)
Creative Commons Attribution (CC BY) : vous pouvez copier, partager, adapter et réutiliser ce contenu, y compris à des fins commerciales, à condition de citer statistics.wiki et d’indiquer les modifications apportées. Les sources citées ci-dessus peuvent avoir leurs propres conditions de licence.