
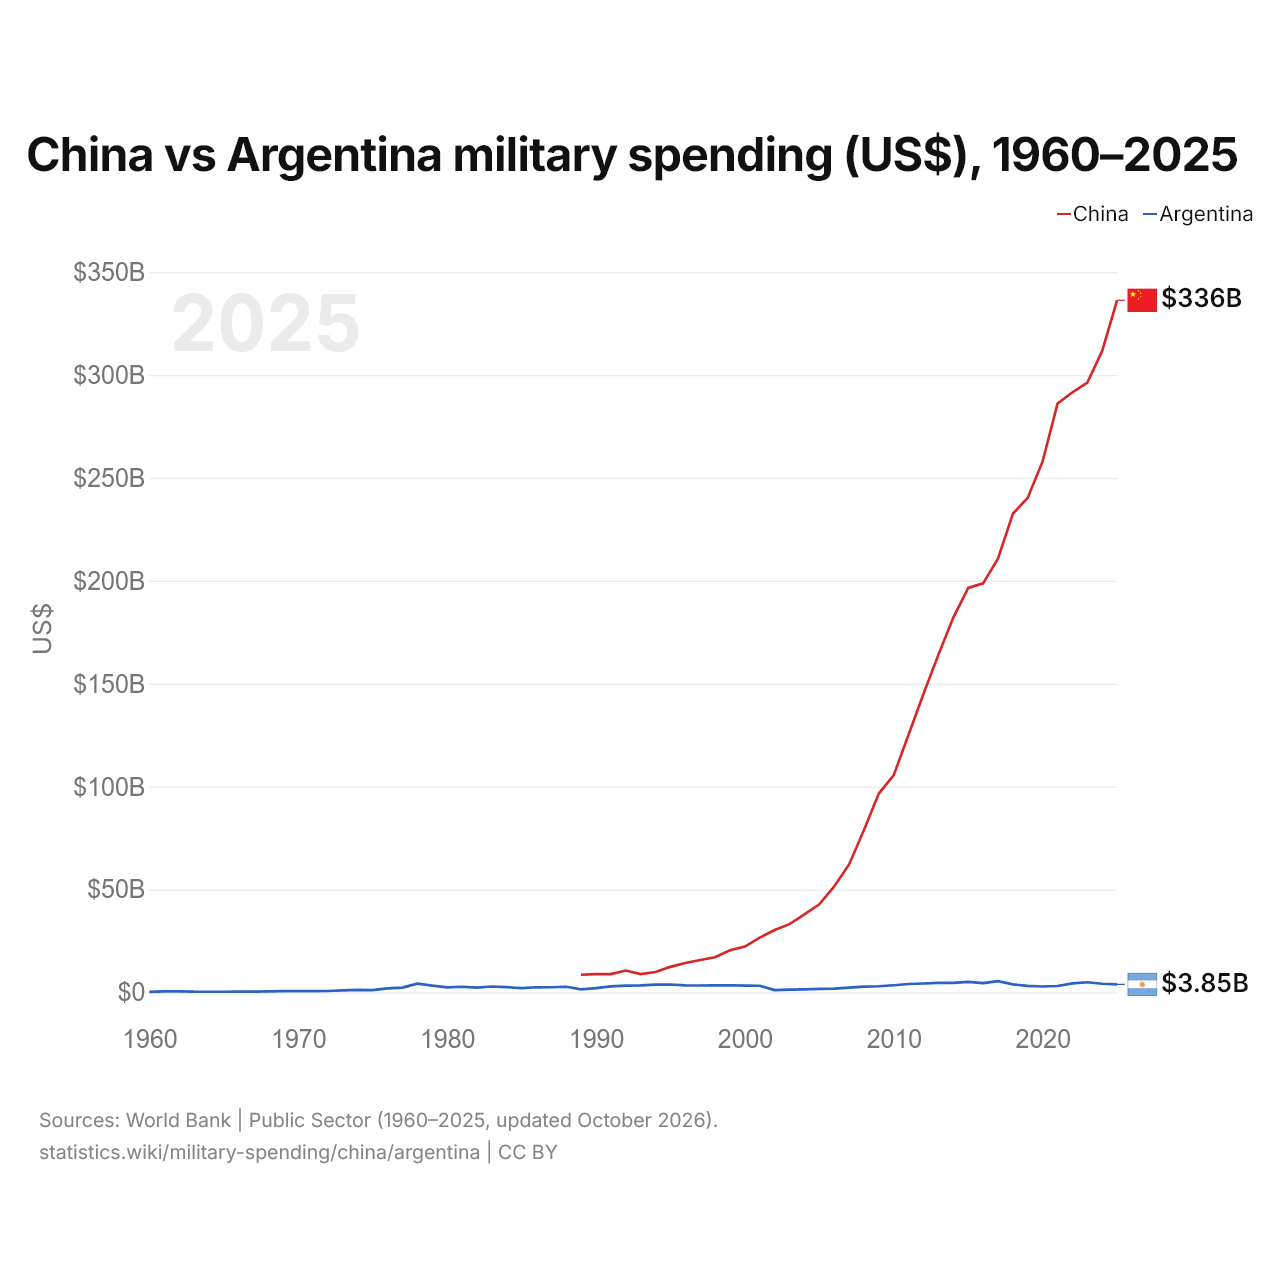
Chine vs Argentine : dépenses militaires ($ US), 1960–2025
| Année | $ US | |
|---|---|---|
 Chine |
 Argentine |
|
| 2025 | 336 287 231 605 $ US | 3 847 030 490 $ US |
| 2024 | 311 665 138 265 $ US | 4 179 838 658 $ US |
| 2023 | 296 256 203 951 $ US | 4 882 352 994 $ US |
| 2022 | 291 568 562 171 $ US | 4 340 235 091 $ US |
| 2021 | 286 064 638 567 $ US | 3 074 056 518 $ US |
| 2020 | 258 019 548 371 $ US | 2 831 765 795 $ US |
| 2019 | 240 319 161 881 $ US | 3 132 922 213 $ US |
| 2018 | 232 542 142 774 $ US | 3 843 257 896 $ US |
| 2017 | 210 662 390 407 $ US | 5 456 390 671 $ US |
| 2016 | 198 704 590 486 $ US | 4 511 804 451 $ US |
| 2015 | 196 538 816 914 $ US | 5 056 133 759 $ US |
| 2014 | 182 109 207 418 $ US | 4 621 617 919 $ US |
| 2013 | 164 070 522 281 $ US | 4 624 515 687 $ US |
| 2012 | 145 127 514 112 $ US | 4 285 004 735 $ US |
| 2011 | 125 286 379 045 $ US | 4 051 930 111 $ US |
| 2010 | 105 522 663 688 $ US | 3 452 047 165 $ US |
| 2009 | 96 601 723 318 $ US | 2 951 865 094 $ US |
| 2008 | 78 840 721 778 $ US | 2 757 807 340 $ US |
| 2007 | 62 136 574 418 $ US | 2 278 817 797 $ US |
| 2006 | 51 453 409 257 $ US | 1 833 095 114 $ US |
| 2005 | 42 789 969 318 $ US | 1 683 610 808 $ US |
| 2004 | 37 904 590 328 $ US | 1 454 415 858 $ US |
| 2003 | 33 144 012 495 $ US | 1 353 563 895 $ US |
| 2002 | 30 284 162 946 $ US | 1 067 029 325 $ US |
| 2001 | 26 561 469 416 $ US | 3 181 997 039 $ US |
| 2000 | 22 237 129 406 $ US | 3 264 997 128 $ US |
| 1999 | 20 473 915 095 $ US | 3 460 000 000 $ US |
| 1998 | 17 031 784 314 $ US | 3 397 002 841 $ US |
| 1997 | 15 699 572 881 $ US | 3 339 000 000 $ US |
| 1996 | 14 275 429 174 $ US | 3 377 996 897 $ US |
| 1995 | 12 385 133 924 $ US | 3 800 996 317 $ US |
| 1994 | 9 867 096 438 $ US | 3 751 000 000 $ US |
| 1993 | 8 878 751 200 $ US | 3 368 367 988 $ US |
| 1992 | 10 600 018 367 $ US | 3 251 456 838 $ US |
| 1991 | 8 886 972 511 $ US | 2 858 940 824 $ US |
| 1990 | 8 872 746 298 $ US | 2 050 898 683 $ US |
| 1989 | 8 525 225 432 $ US | 1 440 919 053 $ US |
| 1988 | - | 2 696 340 375 $ US |
| 1987 | - | 2 485 661 588 $ US |
| 1986 | - | 2 449 546 586 $ US |
| 1985 | - | 2 027 221 261 $ US |
| 1984 | - | 2 527 749 192 $ US |
| 1983 | - | 2 847 793 071 $ US |
| 1982 | - | 2 280 144 825 $ US |
| 1981 | - | 2 726 425 231 $ US |
| 1980 | - | 2 385 017 949 $ US |
| 1979 | - | 3 236 408 047 $ US |
| 1978 | - | 4 202 371 974 $ US |
| 1977 | - | 2 276 123 224 $ US |
| 1976 | - | 1 934 867 782 $ US |
| 1975 | - | 1 070 775 188 $ US |
| 1974 | - | 1 201 859 183 $ US |
| 1973 | - | 971 313 374 $ US |
| 1972 | - | 633 463 772 $ US |
| 1971 | - | 601 838 599 $ US |
| 1970 | - | 593 081 284 $ US |
| 1969 | - | 605 590 513 $ US |
| 1968 | - | 445 649 879 $ US |
| 1967 | - | 339 593 346 $ US |
| 1966 | - | 334 403 945 $ US |
| 1965 | - | 303 288 354 $ US |
| 1964 | - | 294 460 368 $ US |
| 1963 | - | 306 971 678 $ US |
| 1962 | - | 487 782 584 $ US |
| 1961 | - | 430 829 516 $ US |
| 1960 | - | 245 914 852 $ US |
En 2025, les dépenses militaires s'élevaient à 336 milliards de dollars en Chine et à 3,85 milliards de dollars en Argentine : 87 fois plus en Chine. En 1989, elles s'élevaient à 8,53 milliards de dollars en Chine et à 1,44 milliard de dollars en Argentine, soit 5,9 fois plus en Chine.
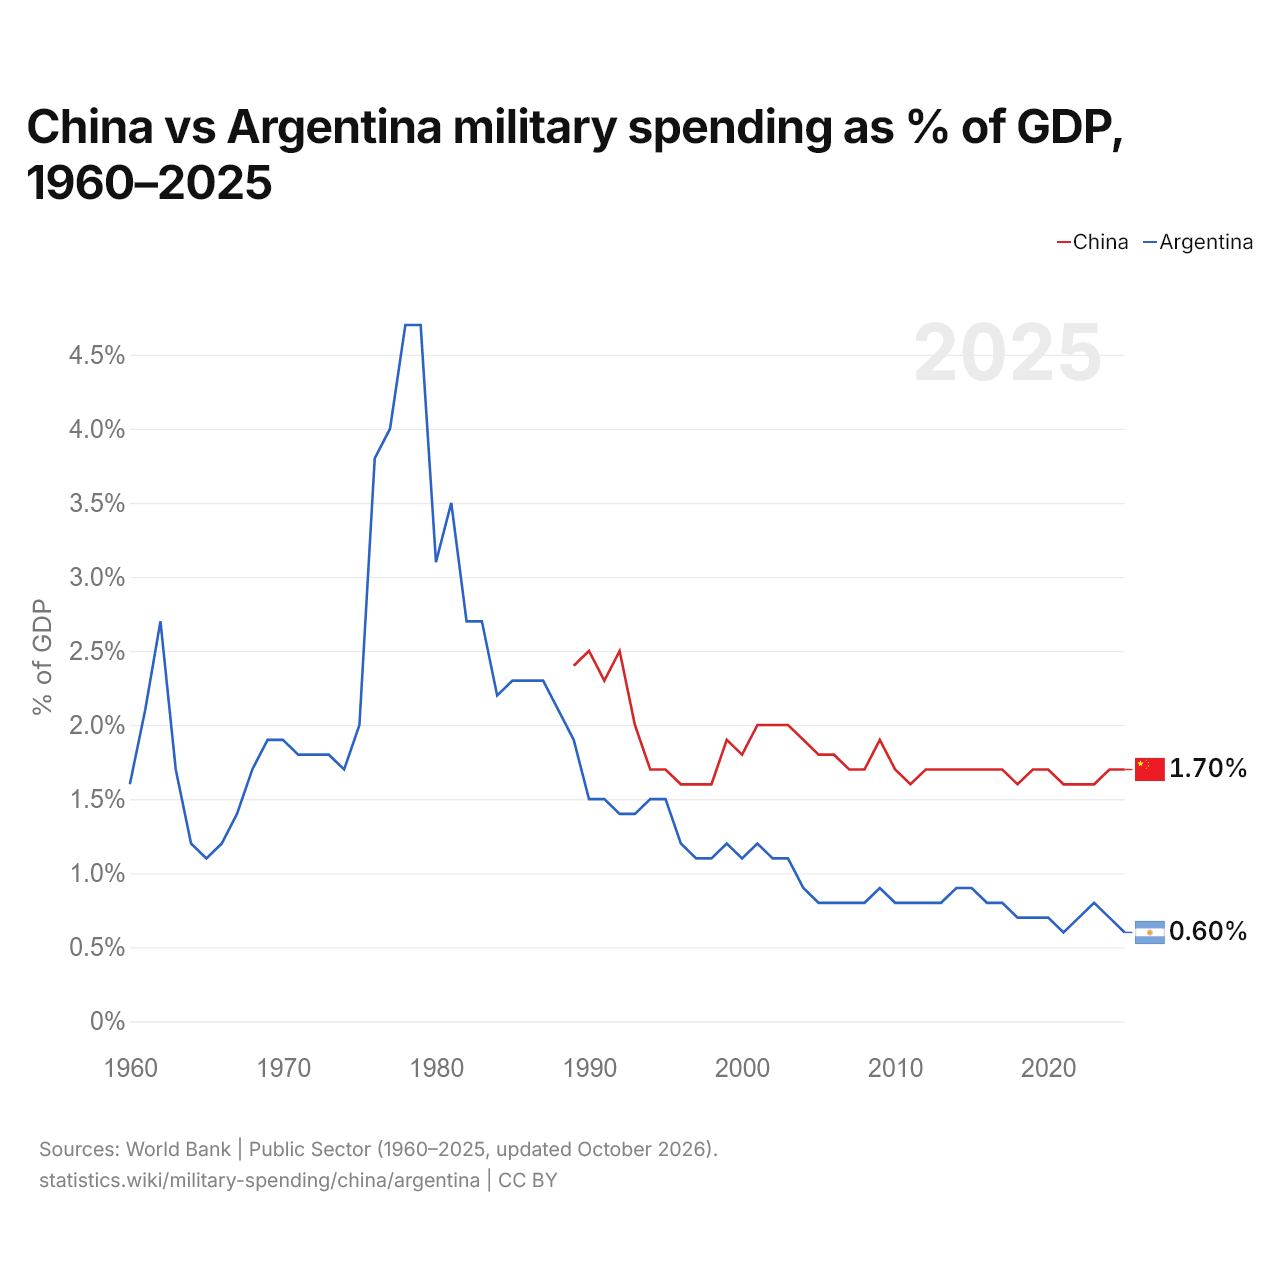
Chine vs Argentine : dépenses militaires en % du PIB, 1960–2025
| Année | % du PIB | |
|---|---|---|
|
Chine
|
Argentine
|
|
| 2025 | 1,7 % | 0,6 % |
| 2024 | 1,7 % | 0,7 % |
| 2023 | 1,6 % | 0,8 % |
| 2022 | 1,6 % | 0,7 % |
| 2021 | 1,6 % | 0,6 % |
| 2020 | 1,7 % | 0,7 % |
| 2019 | 1,7 % | 0,7 % |
| 2018 | 1,6 % | 0,7 % |
| 2017 | 1,7 % | 0,8 % |
| 2016 | 1,7 % | 0,8 % |
| 2015 | 1,7 % | 0,9 % |
| 2014 | 1,7 % | 0,9 % |
| 2013 | 1,7 % | 0,8 % |
| 2012 | 1,7 % | 0,8 % |
| 2011 | 1,6 % | 0,8 % |
| 2010 | 1,7 % | 0,8 % |
| 2009 | 1,9 % | 0,9 % |
| 2008 | 1,7 % | 0,8 % |
| 2007 | 1,7 % | 0,8 % |
| 2006 | 1,8 % | 0,8 % |
| 2005 | 1,8 % | 0,8 % |
| 2004 | 1,9 % | 0,9 % |
| 2003 | 2 % | 1,1 % |
| 2002 | 2 % | 1,1 % |
| 2001 | 2 % | 1,2 % |
| 2000 | 1,8 % | 1,1 % |
| 1999 | 1,9 % | 1,2 % |
| 1998 | 1,6 % | 1,1 % |
| 1997 | 1,6 % | 1,1 % |
| 1996 | 1,6 % | 1,2 % |
| 1995 | 1,7 % | 1,5 % |
| 1994 | 1,7 % | 1,5 % |
| 1993 | 2 % | 1,4 % |
| 1992 | 2,5 % | 1,4 % |
| 1991 | 2,3 % | 1,5 % |
| 1990 | 2,5 % | 1,5 % |
| 1989 | 2,4 % | 1,9 % |
| 1988 | - | 2,1 % |
| 1987 | - | 2,3 % |
| 1986 | - | 2,3 % |
| 1985 | - | 2,3 % |
| 1984 | - | 2,2 % |
| 1983 | - | 2,7 % |
| 1982 | - | 2,7 % |
| 1981 | - | 3,5 % |
| 1980 | - | 3,1 % |
| 1979 | - | 4,7 % |
| 1978 | - | 4,7 % |
| 1977 | - | 4 % |
| 1976 | - | 3,8 % |
| 1975 | - | 2 % |
| 1974 | - | 1,7 % |
| 1973 | - | 1,8 % |
| 1972 | - | 1,8 % |
| 1971 | - | 1,8 % |
| 1970 | - | 1,9 % |
| 1969 | - | 1,9 % |
| 1968 | - | 1,7 % |
| 1967 | - | 1,4 % |
| 1966 | - | 1,2 % |
| 1965 | - | 1,1 % |
| 1964 | - | 1,2 % |
| 1963 | - | 1,7 % |
| 1962 | - | 2,7 % |
| 1961 | - | 2,1 % |
| 1960 | - | 1,6 % |
En 2025, les dépenses militaires représentaient 1,7 % du PIB en Chine et 0,6 % en Argentine : 1,1 points de pourcentage de plus en Chine. En 2015, elles représentaient 1,7 % en Chine et 0,9 % en Argentine, soit 0,8 points de pourcentage de plus en Chine.
Les dépenses militaires de la Chine, en part du PIB, sont supérieures à celles de l'Argentine chaque année depuis 1989.
Chine vs Argentine : chiffres des dépenses militaires
|
Chine
|
Argentine
|
|
|---|---|---|
| $ US, 2025 | 336 Md $US | 3,85 Md $US |
| % du PIB, 2025 | 1,7 % | 0,6 % |
| Par personne, $ US | 239,1 $US | 83,9 $US |
| Part mondiale | 11,8 % | 0,13 % |
| Rang mondial | 2/154 | 52/154 |
Comparer les dépenses militaires de 2 pays au choix
Sources :
- Banque mondiale | Secteur public (1960–2025, mis à jour en octobre 2026)
Creative Commons Attribution (CC BY) : vous pouvez copier, partager, adapter et réutiliser ce contenu, y compris à des fins commerciales, à condition de citer statistics.wiki et d’indiquer les modifications apportées. Les sources citées ci-dessus peuvent avoir leurs propres conditions de licence.