
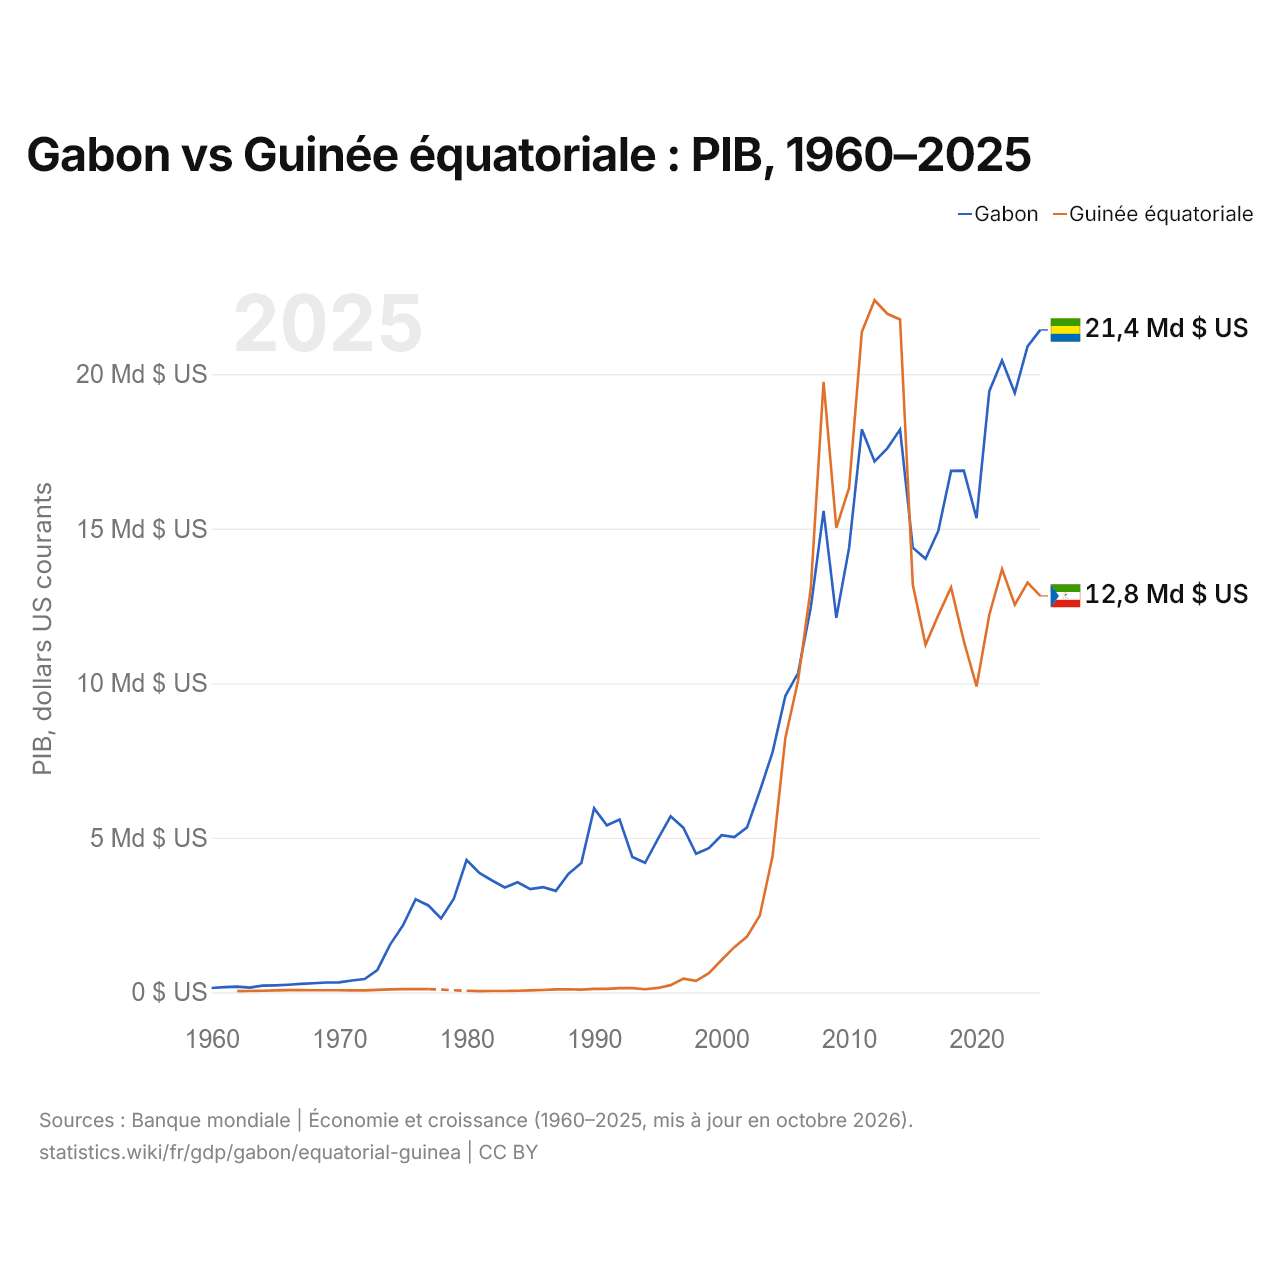
Gabon vs Guinée équatoriale : PIB, 1960–2025
| Année | PIB, dollars US courants | |
|---|---|---|
 Gabon |
 Guinée équatoriale |
|
| 2025 | 21 427 119 323 $ US | 12 823 210 426 $ US |
| 2024 | 20 895 684 426 $ US | 13 254 388 261 $ US |
| 2023 | 19 388 372 071 $ US | 12 541 814 273 $ US |
| 2022 | 20 440 655 695 $ US | 13 687 643 436 $ US |
| 2021 | 19 444 935 097 $ US | 12 215 878 033 $ US |
| 2020 | 15 342 236 164 $ US | 9 893 816 008 $ US |
| 2019 | 16 874 405 465 $ US | 11 364 133 550 $ US |
| 2018 | 16 867 326 402 $ US | 13 097 012 134 $ US |
| 2017 | 14 929 487 485 $ US | 12 200 913 879 $ US |
| 2016 | 14 023 890 265 $ US | 11 240 808 848 $ US |
| 2015 | 14 383 107 763 $ US | 13 185 496 881 $ US |
| 2014 | 18 203 966 896 $ US | 21 765 453 082 $ US |
| 2013 | 17 595 744 798 $ US | 21 948 834 284 $ US |
| 2012 | 17 170 464 016 $ US | 22 388 344 144 $ US |
| 2011 | 18 210 307 744 $ US | 21 357 343 669 $ US |
| 2010 | 14 372 593 020 $ US | 16 314 443 436 $ US |
| 2009 | 12 113 699 068 $ US | 15 027 795 173 $ US |
| 2008 | 15 571 348 344 $ US | 19 749 893 536 $ US |
| 2007 | 12 455 409 587 $ US | 13 071 718 759 $ US |
| 2006 | 10 327 598 306 $ US | 10 086 528 699 $ US |
| 2005 | 9 582 783 991 $ US | 8 217 369 093 $ US |
| 2004 | 7 770 219 008 $ US | 4 410 764 339 $ US |
| 2003 | 6 511 903 365 $ US | 2 484 745 935 $ US |
| 2002 | 5 335 451 100 $ US | 1 806 742 742 $ US |
| 2001 | 5 023 265 413 $ US | 1 461 139 022 $ US |
| 2000 | 5 080 483 629 $ US | 1 045 998 496 $ US |
| 1999 | 4 662 992 036 $ US | 621 117 886 $ US |
| 1998 | 4 483 417 310 $ US | 370 687 634 $ US |
| 1997 | 5 326 817 115 $ US | 442 337 871 $ US |
| 1996 | 5 694 040 003 $ US | 232 463 023 $ US |
| 1995 | 4 958 845 648 $ US | 141 853 361 $ US |
| 1994 | 4 190 819 344 $ US | 100 807 003 $ US |
| 1993 | 4 378 645 081 $ US | 136 047 906 $ US |
| 1992 | 5 592 390 827 $ US | 134 707 184 $ US |
| 1991 | 5 402 919 785 $ US | 110 906 029 $ US |
| 1990 | 5 952 293 765 $ US | 112 119 411 $ US |
| 1989 | 4 186 411 464 $ US | 88 265 975 $ US |
| 1988 | 3 834 503 376 $ US | 100 534 657 $ US |
| 1987 | 3 281 797 043 $ US | 93 345 860 $ US |
| 1986 | 3 403 638 189 $ US | 76 407 396 $ US |
| 1985 | 3 339 914 757 $ US | 62 118 570 $ US |
| 1984 | 3 561 451 561 $ US | 50 320 914 $ US |
| 1983 | 3 391 275 732 $ US | 44 442 457 $ US |
| 1982 | 3 618 007 841 $ US | 44 294 648 $ US |
| 1981 | 3 862 269 121 $ US | 36 731 423 $ US |
| 1980 | 4 279 637 942 $ US | 50 642 881 $ US |
| 1979 | 3 030 251 120 $ US | - |
| 1978 | 2 389 479 272 $ US | - |
| 1977 | 2 809 349 069 $ US | 103 987 520 $ US |
| 1976 | 3 009 409 974 $ US | 103 653 050 $ US |
| 1975 | 2 157 592 940 $ US | 104 295 643 $ US |
| 1974 | 1 544 216 002 $ US | 94 159 863 $ US |
| 1973 | 722 780 701 $ US | 81 203 227 $ US |
| 1972 | 430 508 359 $ US | 65 429 198 $ US |
| 1971 | 381 687 073 $ US | 64 946 955 $ US |
| 1970 | 323 802 476 $ US | 66 331 429 $ US |
| 1969 | 318 124 701 $ US | 67 225 714 $ US |
| 1968 | 294 468 564 $ US | 67 514 286 $ US |
| 1967 | 271 543 680 $ US | 72 317 447 $ US |
| 1966 | 245 849 781 $ US | 69 110 000 $ US |
| 1965 | 226 474 286 $ US | 64 748 333 $ US |
| 1964 | 215 679 855 $ US | 51 915 000 $ US |
| 1963 | 154 480 244 $ US | 44 266 667 $ US |
| 1962 | 182 796 536 $ US | 37 253 333 $ US |
| 1961 | 167 637 907 $ US | - |
| 1960 | 141 468 978 $ US | - |
En 2025, le PIB du Gabon (21,4 milliards de dollars US) était 1,7 fois celui de la Guinée équatoriale (12,8 milliards de dollars US). En 2015, l'écart était de 9,1 %. De 2015 à 2025, à prix constants de 2015, le PIB du Gabon a progressé de 19,7 %, tandis que celui de la Guinée équatoriale a reculé de 33,9 %.
Depuis 2015, le PIB du Gabon est le plus élevé des deux ; il l'était aussi en 1962, 4,9 fois celui de la Guinée équatoriale. En 2025, le PIB par habitant était de 8 263 $ US au Gabon et de 6 615 $ US en Guinée équatoriale, soit 25 % de plus au Gabon.
Gabon vs Guinée équatoriale : derniers chiffres du PIB
|
Gabon
|
Guinée équatoriale
|
|
|---|---|---|
| PIB, dollars US courants | 21,4 Md $US | 12,8 Md $US |
| Rang mondial | 132/197 | 150/197 |
| Part mondiale | 0,02 % | 0,01 % |
| PIB, dollars US constants de 2015 | 17,2 Md $US | 8,72 Md $US |
| Écart de PIB | 1,7× | 0,6× |
Comparer le PIB de 2 pays au choix
Sources :
- Banque mondiale | Économie et croissance (1960–2025, mis à jour en octobre 2026)
Creative Commons Attribution (CC BY) : vous pouvez copier, partager, adapter et réutiliser ce contenu, y compris à des fins commerciales, à condition de citer statistics.wiki et d’indiquer les modifications apportées. Les sources citées ci-dessus peuvent avoir leurs propres conditions de licence.