
Gabon vs Guinée équatoriale : PIB par habitant, 1960–2025
| Année | PIB par habitant, dollars US courants | |
|---|---|---|
 Gabon |
 Guinée équatoriale |
|
| 2025 | 8 263 $ US | 6 615 $ US |
| 2024 | 8 230 $ US | 7 004 $ US |
| 2023 | 7 803 $ US | 6 788 $ US |
| 2022 | 8 409 $ US | 7 589 $ US |
| 2021 | 8 181 $ US | 6 946 $ US |
| 2020 | 6 606 $ US | 5 764 $ US |
| 2019 | 7 441 $ US | 6 804 $ US |
| 2018 | 7 624 $ US | 8 102 $ US |
| 2017 | 6 922 $ US | 7 809 $ US |
| 2016 | 6 677 $ US | 7 453 $ US |
| 2015 | 7 047 $ US | 9 069 $ US |
| 2014 | 9 201 $ US | 15 549 $ US |
| 2013 | 9 198 $ US | 16 304 $ US |
| 2012 | 9 297 $ US | 17 309 $ US |
| 2011 | 10 219 $ US | 17 198 $ US |
| 2010 | 8 357 $ US | 13 720 $ US |
| 2009 | 7 291 $ US | 13 233 $ US |
| 2008 | 9 689 $ US | 18 211 $ US |
| 2007 | 8 004 $ US | 12 617 $ US |
| 2006 | 6 847 $ US | 10 185 $ US |
| 2005 | 6 548 $ US | 8 674 $ US |
| 2004 | 5 466 $ US | 4 901 $ US |
| 2003 | 4 711 $ US | 2 931 $ US |
| 2002 | 3 966 $ US | 2 264 $ US |
| 2001 | 3 836 $ US | 1 949 $ US |
| 2000 | 3 983 $ US | 1 487 $ US |
| 1999 | 3 751 $ US | 931 $ US |
| 1998 | 3 700 $ US | 578 $ US |
| 1997 | 4 509 $ US | 717 $ US |
| 1996 | 4 943 $ US | 392 $ US |
| 1995 | 4 415 $ US | 248,3 $ US |
| 1994 | 3 828 $ US | 183,2 $ US |
| 1993 | 4 106 $ US | 256,7 $ US |
| 1992 | 5 386 $ US | 263,7 $ US |
| 1991 | 5 345 $ US | 225,3 $ US |
| 1990 | 6 051 $ US | 236,4 $ US |
| 1989 | 4 374 $ US | 193,2 $ US |
| 1988 | 4 119 $ US | 228,7 $ US |
| 1987 | 3 624 $ US | 220,9 $ US |
| 1986 | 3 865 $ US | 188,8 $ US |
| 1985 | 3 898 $ US | 161,1 $ US |
| 1984 | 4 273 $ US | 137,9 $ US |
| 1983 | 4 182 $ US | 129,4 $ US |
| 1982 | 4 584 $ US | 137,5 $ US |
| 1981 | 5 026 $ US | 121,1 $ US |
| 1980 | 5 718 $ US | 175,5 $ US |
| 1979 | 4 155 $ US | - |
| 1978 | 3 360 $ US | - |
| 1977 | 4 048 $ US | 376 $ US |
| 1976 | 4 441 $ US | 369 $ US |
| 1975 | 3 258 $ US | 362 $ US |
| 1974 | 2 384 $ US | 319 $ US |
| 1973 | 1 140 $ US | 268,6 $ US |
| 1972 | 693 $ US | 211,4 $ US |
| 1971 | 627 $ US | 205,6 $ US |
| 1970 | 543 $ US | 206,8 $ US |
| 1969 | 545 $ US | 208,4 $ US |
| 1968 | 515 $ US | 211,7 $ US |
| 1967 | 482 $ US | 231,9 $ US |
| 1966 | 443 $ US | 226,7 $ US |
| 1965 | 415 $ US | 217,1 $ US |
| 1964 | 400 $ US | 177,8 $ US |
| 1963 | 290,7 $ US | 154,8 $ US |
| 1962 | 348 $ US | 132,9 $ US |
| 1961 | 323 $ US | - |
| 1960 | 276,1 $ US | - |
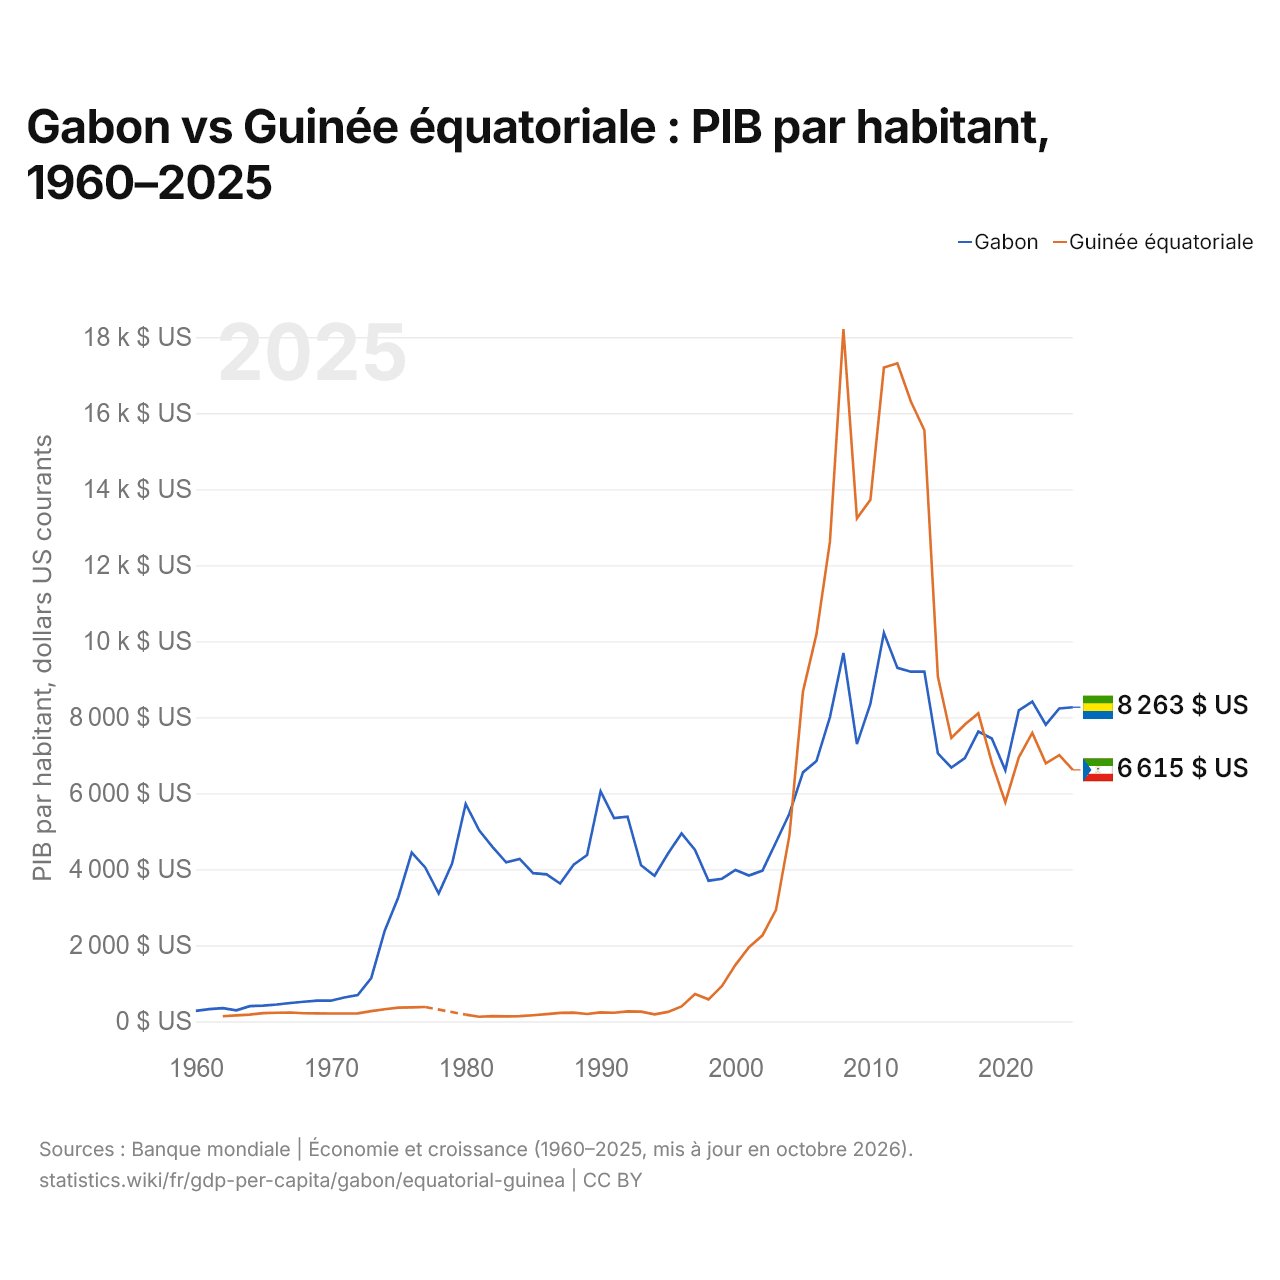
En 2025, le PIB par habitant était de 8 263 $ US au Gabon et de 6 615 $ US en Guinée équatoriale : 25 % de plus au Gabon. En 1962, il était de 348 $ US au Gabon et de 133 $ US en Guinée équatoriale, soit 2,6 fois plus au Gabon.
Le PIB par habitant du Gabon est plus élevé que celui de la Guinée équatoriale chaque année depuis 2019. À prix constants de 2015, entre 1980 et 2025, le PIB par habitant du Gabon a reculé de 28 %, et celui de la Guinée équatoriale a progressé de 883 %.
Gabon vs Guinée équatoriale : derniers chiffres du PIB par habitant
|
Gabon
|
Guinée équatoriale
|
|
|---|---|---|
| PIB par habitant, dollars US courants | 8 263 $US | 6 615 $US |
| Rang mondial | 96/197 | 107/197 |
| PIB par habitant, dollars US constants de 2015 | 6 641 $US | 4 498 $US |
| × moyenne mondiale | 0,57× | 0,46× |
| Écart de PIB par habitant | 1,2× | 0,8× |
Comparer le PIB par habitant de 2 pays au choix
Sources :
- Banque mondiale | Économie et croissance (1960–2025, mis à jour en octobre 2026)
Creative Commons Attribution (CC BY) : vous pouvez copier, partager, adapter et réutiliser ce contenu, y compris à des fins commerciales, à condition de citer statistics.wiki et d’indiquer les modifications apportées. Les sources citées ci-dessus peuvent avoir leurs propres conditions de licence.