
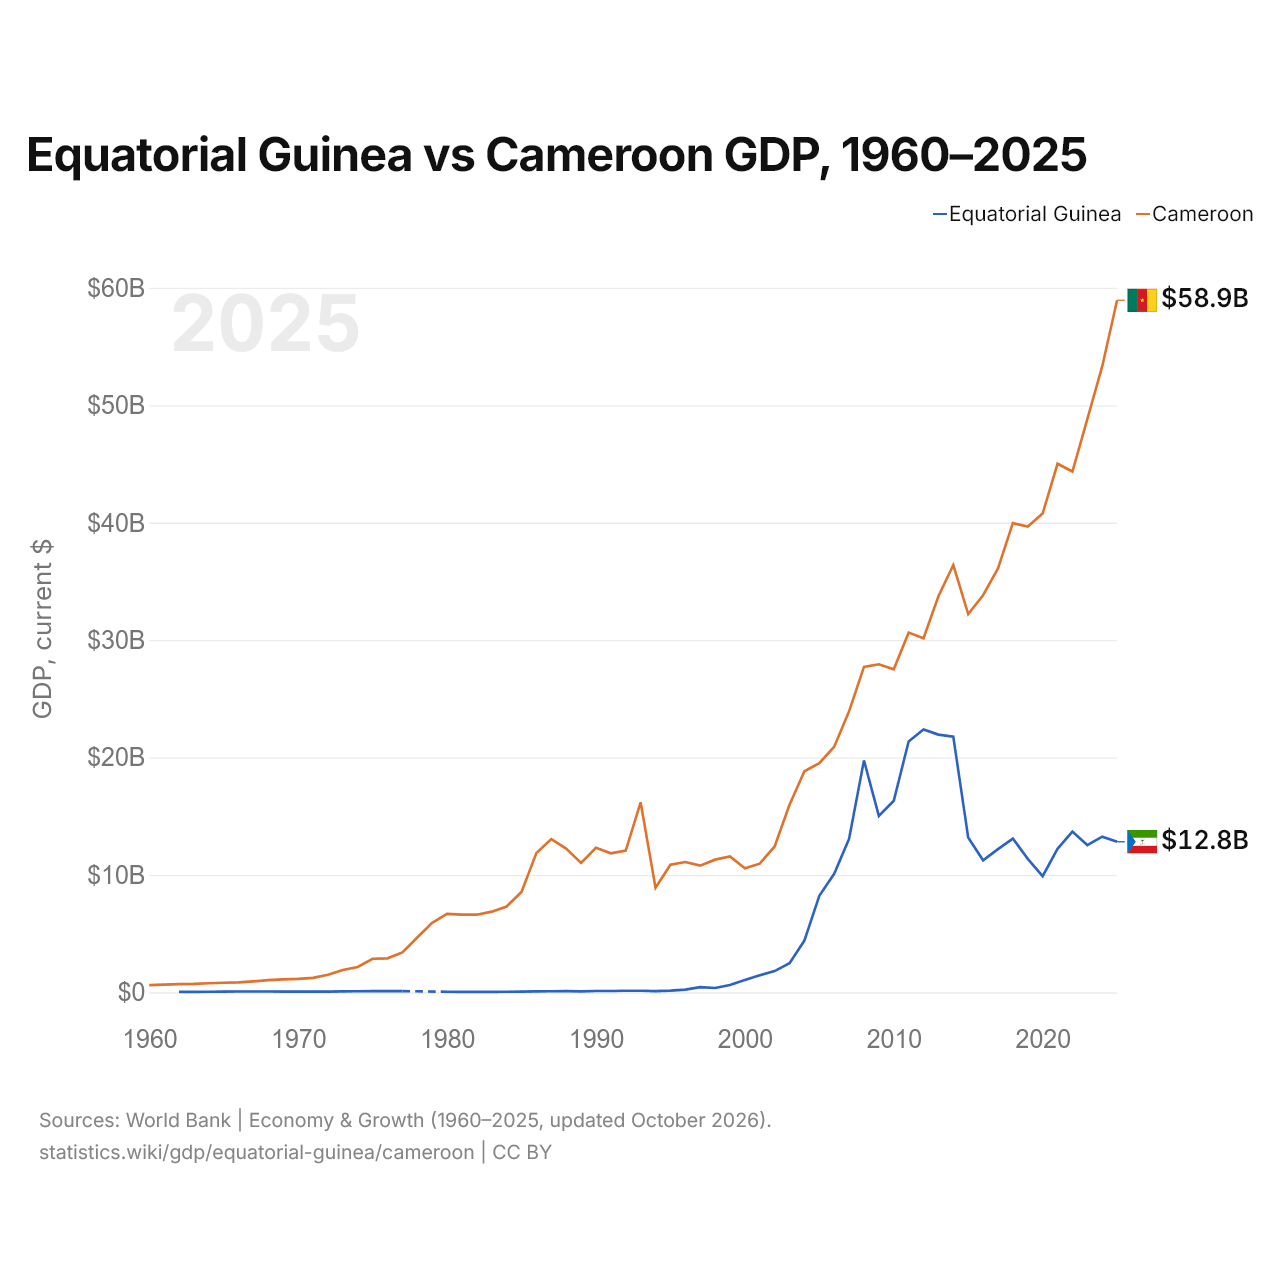
Guinée équatoriale vs Cameroun : PIB, 1960–2025
| Année | PIB, dollars US courants | |
|---|---|---|
 Guinée équatoriale |
 Cameroun |
|
| 2025 | 12 823 210 426 $ US | 58 933 453 924 $ US |
| 2024 | 13 254 388 261 $ US | 53 296 694 320 $ US |
| 2023 | 12 541 814 273 $ US | 48 814 501 547 $ US |
| 2022 | 13 687 643 436 $ US | 44 347 206 073 $ US |
| 2021 | 12 215 878 033 $ US | 45 011 937 347 $ US |
| 2020 | 9 893 816 008 $ US | 40 773 241 177 $ US |
| 2019 | 11 364 133 550 $ US | 39 667 757 528 $ US |
| 2018 | 13 097 012 134 $ US | 39 955 552 190 $ US |
| 2017 | 12 200 913 879 $ US | 36 098 547 033 $ US |
| 2016 | 11 240 808 848 $ US | 33 814 337 044 $ US |
| 2015 | 13 185 496 881 $ US | 32 210 233 020 $ US |
| 2014 | 21 765 453 082 $ US | 36 386 544 706 $ US |
| 2013 | 21 948 834 284 $ US | 33 728 621 180 $ US |
| 2012 | 22 388 344 144 $ US | 30 155 062 329 $ US |
| 2011 | 21 357 343 669 $ US | 30 630 910 495 $ US |
| 2010 | 16 314 443 436 $ US | 27 507 501 821 $ US |
| 2009 | 15 027 795 173 $ US | 27 932 970 317 $ US |
| 2008 | 19 749 893 536 $ US | 27 715 142 033 $ US |
| 2007 | 13 071 718 759 $ US | 23 928 250 433 $ US |
| 2006 | 10 086 528 699 $ US | 20 910 512 975 $ US |
| 2005 | 8 217 369 093 $ US | 19 509 852 207 $ US |
| 2004 | 4 410 764 339 $ US | 18 826 214 136 $ US |
| 2003 | 2 484 745 935 $ US | 15 970 315 035 $ US |
| 2002 | 1 806 742 742 $ US | 12 417 251 350 $ US |
| 2001 | 1 461 139 022 $ US | 10 953 485 349 $ US |
| 2000 | 1 045 998 496 $ US | 10 566 579 295 $ US |
| 1999 | 621 117 886 $ US | 11 565 826 465 $ US |
| 1998 | 370 687 634 $ US | 11 298 144 990 $ US |
| 1997 | 442 337 871 $ US | 10 789 458 433 $ US |
| 1996 | 232 463 023 $ US | 11 093 538 846 $ US |
| 1995 | 141 853 361 $ US | 10 864 772 471 $ US |
| 1994 | 100 807 003 $ US | 8 902 446 252 $ US |
| 1993 | 136 047 906 $ US | 16 181 814 713 $ US |
| 1992 | 134 707 184 $ US | 12 071 775 335 $ US |
| 1991 | 110 906 029 $ US | 11 840 192 296 $ US |
| 1990 | 112 119 411 $ US | 12 314 482 628 $ US |
| 1989 | 88 265 975 $ US | 11 012 566 195 $ US |
| 1988 | 100 534 657 $ US | 12 236 057 362 $ US |
| 1987 | 93 345 860 $ US | 13 049 659 981 $ US |
| 1986 | 76 407 396 $ US | 11 857 056 199 $ US |
| 1985 | 62 118 570 $ US | 8 544 810 498 $ US |
| 1984 | 50 320 914 $ US | 7 311 938 026 $ US |
| 1983 | 44 442 457 $ US | 6 870 200 010 $ US |
| 1982 | 44 294 648 $ US | 6 611 255 964 $ US |
| 1981 | 36 731 423 $ US | 6 610 938 617 $ US |
| 1980 | 50 642 881 $ US | 6 674 569 047 $ US |
| 1979 | - | 5 919 002 983 $ US |
| 1978 | - | 4 662 852 583 $ US |
| 1977 | 103 987 520 $ US | 3 394 664 024 $ US |
| 1976 | 103 653 050 $ US | 2 898 090 002 $ US |
| 1975 | 104 295 643 $ US | 2 857 037 371 $ US |
| 1974 | 94 159 863 $ US | 2 157 415 533 $ US |
| 1973 | 81 203 227 $ US | 1 901 393 361 $ US |
| 1972 | 65 429 198 $ US | 1 498 251 890 $ US |
| 1971 | 64 946 955 $ US | 1 236 941 394 $ US |
| 1970 | 66 331 429 $ US | 1 151 216 993 $ US |
| 1969 | 67 225 714 $ US | 1 100 551 489 $ US |
| 1968 | 67 514 286 $ US | 1 046 191 218 $ US |
| 1967 | 72 317 447 $ US | 936 175 260 $ US |
| 1966 | 69 110 000 $ US | 851 112 535 $ US |
| 1965 | 64 748 333 $ US | 814 083 266 $ US |
| 1964 | 51 915 000 $ US | 776 650 177 $ US |
| 1963 | 44 266 667 $ US | 718 320 845 $ US |
| 1962 | 37 253 333 $ US | 694 247 864 $ US |
| 1961 | - | 652 777 608 $ US |
| 1960 | - | 614 206 068 $ US |
En 2025, le PIB du Cameroun (58,9 milliards de dollars US) était 4,6 fois celui de la Guinée équatoriale (12,8 milliards de dollars US). En 2015, le rapport était de 2,4. De 2015 à 2025, à prix constants de 2015, le PIB du Cameroun a progressé de 38,2 %, tandis que celui de la Guinée équatoriale a reculé de 33,9 %.
Depuis 1962, le PIB du Cameroun a chaque année été le plus élevé des deux ; en 1962, il était 19 fois celui de la Guinée équatoriale. En 2025, le PIB par habitant était de 6 615 $ US en Guinée équatoriale et de 1 972 $ US au Cameroun, soit 3,4 fois plus élevé en Guinée équatoriale.
Guinée équatoriale vs Cameroun : derniers chiffres du PIB
|
Guinée équatoriale
|
Cameroun
|
|
|---|---|---|
| PIB, dollars US courants | 12,8 Md $US | 58,9 Md $US |
| Rang mondial | 150/197 | 92/197 |
| Part mondiale | 0,01 % | 0,05 % |
| PIB, dollars US constants de 2015 | 8,72 Md $US | 44,5 Md $US |
| Écart de PIB | 0,22× | 4,6× |
Comparer le PIB de 2 pays au choix
Sources :
- Banque mondiale | Économie et croissance (1960–2025, mis à jour en octobre 2026)
Creative Commons Attribution (CC BY) : vous pouvez copier, partager, adapter et réutiliser ce contenu, y compris à des fins commerciales, à condition de citer statistics.wiki et d’indiquer les modifications apportées. Les sources citées ci-dessus peuvent avoir leurs propres conditions de licence.