
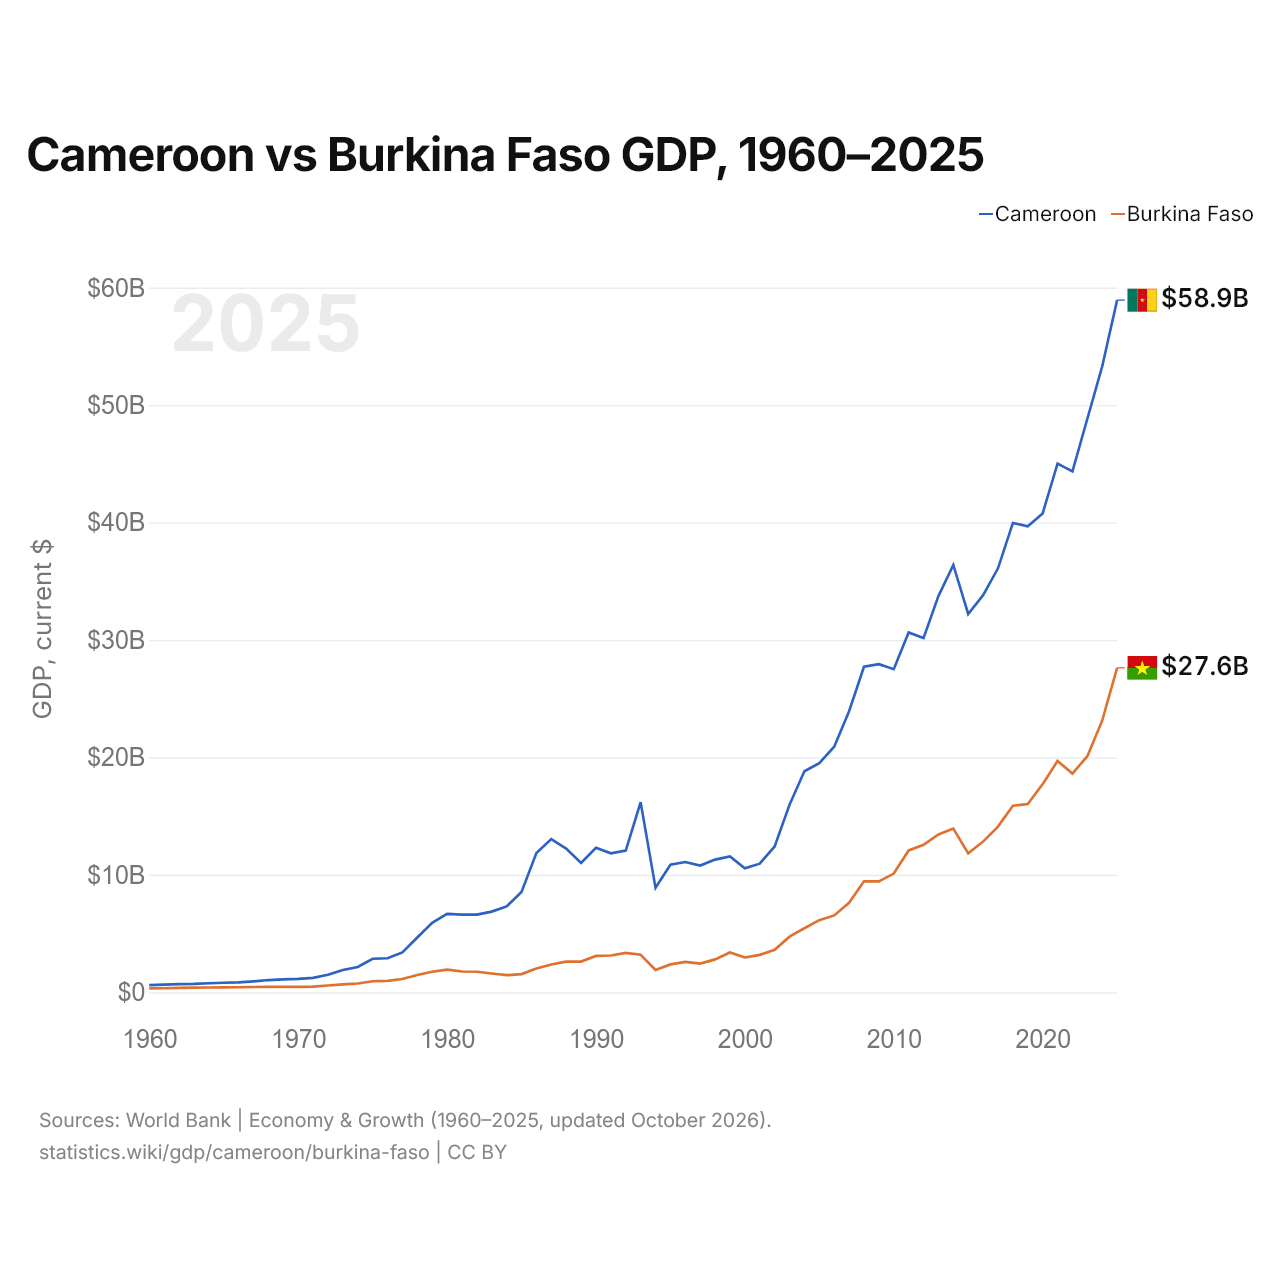
Cameroun vs Burkina Faso : PIB, 1960–2025
| Année | PIB, dollars US courants | |
|---|---|---|
 Cameroun |
 Burkina Faso |
|
| 2025 | 58 933 453 924 $ US | 27 627 297 461 $ US |
| 2024 | 53 296 694 320 $ US | 23 136 514 856 $ US |
| 2023 | 48 814 501 547 $ US | 20 106 062 972 $ US |
| 2022 | 44 347 206 073 $ US | 18 622 421 395 $ US |
| 2021 | 45 011 937 347 $ US | 19 697 516 284 $ US |
| 2020 | 40 773 241 177 $ US | 17 725 010 533 $ US |
| 2019 | 39 667 757 528 $ US | 16 032 813 503 $ US |
| 2018 | 39 955 552 190 $ US | 15 890 066 221 $ US |
| 2017 | 36 098 547 033 $ US | 14 106 955 615 $ US |
| 2016 | 33 814 337 044 $ US | 12 833 363 045 $ US |
| 2015 | 32 210 233 020 $ US | 11 832 159 316 $ US |
| 2014 | 36 386 544 706 $ US | 13 943 016 077 $ US |
| 2013 | 33 728 621 180 $ US | 13 444 300 486 $ US |
| 2012 | 30 155 062 329 $ US | 12 561 015 157 $ US |
| 2011 | 30 630 910 495 $ US | 12 080 295 978 $ US |
| 2010 | 27 507 501 821 $ US | 10 109 619 741 $ US |
| 2009 | 27 932 970 317 $ US | 9 450 696 873 $ US |
| 2008 | 27 715 142 033 $ US | 9 451 435 490 $ US |
| 2007 | 23 928 250 433 $ US | 7 625 722 837 $ US |
| 2006 | 20 910 512 975 $ US | 6 547 419 820 $ US |
| 2005 | 19 509 852 207 $ US | 6 146 353 173 $ US |
| 2004 | 18 826 214 136 $ US | 5 451 688 538 $ US |
| 2003 | 15 970 315 035 $ US | 4 740 768 143 $ US |
| 2002 | 12 417 251 350 $ US | 3 622 350 063 $ US |
| 2001 | 10 953 485 349 $ US | 3 190 371 081 $ US |
| 2000 | 10 566 579 295 $ US | 2 968 370 088 $ US |
| 1999 | 11 565 826 465 $ US | 3 389 566 713 $ US |
| 1998 | 11 298 144 990 $ US | 2 804 902 367 $ US |
| 1997 | 10 789 458 433 $ US | 2 447 669 102 $ US |
| 1996 | 11 093 538 846 $ US | 2 586 550 595 $ US |
| 1995 | 10 864 772 471 $ US | 2 379 517 975 $ US |
| 1994 | 8 902 446 252 $ US | 1 895 290 637 $ US |
| 1993 | 16 181 814 713 $ US | 3 199 536 465 $ US |
| 1992 | 12 071 775 335 $ US | 3 356 692 505 $ US |
| 1991 | 11 840 192 296 $ US | 3 135 045 584 $ US |
| 1990 | 12 314 482 628 $ US | 3 101 300 779 $ US |
| 1989 | 11 012 566 195 $ US | 2 615 587 734 $ US |
| 1988 | 12 236 057 362 $ US | 2 616 040 479 $ US |
| 1987 | 13 049 659 981 $ US | 2 369 834 950 $ US |
| 1986 | 11 857 056 199 $ US | 2 036 303 358 $ US |
| 1985 | 8 544 810 498 $ US | 1 552 493 196 $ US |
| 1984 | 7 311 938 026 $ US | 1 459 880 132 $ US |
| 1983 | 6 870 200 010 $ US | 1 600 278 605 $ US |
| 1982 | 6 611 255 964 $ US | 1 754 450 096 $ US |
| 1981 | 6 610 938 617 $ US | 1 775 842 334 $ US |
| 1980 | 6 674 569 047 $ US | 1 928 719 888 $ US |
| 1979 | 5 919 002 983 $ US | 1 748 480 621 $ US |
| 1978 | 4 662 852 583 $ US | 1 475 583 645 $ US |
| 1977 | 3 394 664 024 $ US | 1 131 224 878 $ US |
| 1976 | 2 898 090 002 $ US | 976 547 188 $ US |
| 1975 | 2 857 037 371 $ US | 939 972 703 $ US |
| 1974 | 2 157 415 533 $ US | 751 133 430 $ US |
| 1973 | 1 901 393 361 $ US | 674 773 570 $ US |
| 1972 | 1 498 251 890 $ US | 578 595 522 $ US |
| 1971 | 1 236 941 394 $ US | 482 411 179 $ US |
| 1970 | 1 151 216 993 $ US | 458 404 269 $ US |
| 1969 | 1 100 551 489 $ US | 478 298 645 $ US |
| 1968 | 1 046 191 218 $ US | 460 442 689 $ US |
| 1967 | 936 175 260 $ US | 450 753 924 $ US |
| 1966 | 851 112 535 $ US | 433 889 766 $ US |
| 1965 | 814 083 266 $ US | 422 916 790 $ US |
| 1964 | 776 650 177 $ US | 410 321 645 $ US |
| 1963 | 718 320 845 $ US | 394 040 667 $ US |
| 1962 | 694 247 864 $ US | 379 567 099 $ US |
| 1961 | 652 777 608 $ US | 350 247 234 $ US |
| 1960 | 614 206 068 $ US | 330 442 816 $ US |
En 2025, le PIB du Cameroun (58,9 milliards de dollars US) était 2,1 fois celui du Burkina Faso (27,6 milliards de dollars US). En 2015, le rapport était de 2,7. De 2015 à 2025, à prix constants de 2015, le PIB du Cameroun a progressé de 38,2 % et celui du Burkina Faso de 60,1 %.
Depuis 1960, le PIB du Cameroun a chaque année été le plus élevé des deux ; en 1960, il était 1,9 fois celui du Burkina Faso. En 2025, le PIB par habitant était de 1 972 $ US au Cameroun et de 1 148 $ US au Burkina Faso, soit 1,7 fois plus élevé au Cameroun.
Cameroun vs Burkina Faso : derniers chiffres du PIB
|
Cameroun
|
Burkina Faso
|
|
|---|---|---|
| PIB, dollars US courants | 58,9 Md $US | 27,6 Md $US |
| Rang mondial | 92/197 | 119/197 |
| Part mondiale | 0,05 % | 0,02 % |
| PIB, dollars US constants de 2015 | 44,5 Md $US | 18,9 Md $US |
| Écart de PIB | 2,1× | 0,47× |
Comparer le PIB de 2 pays au choix
Sources :
- Banque mondiale | Économie et croissance (1960–2025, mis à jour en octobre 2026)
Creative Commons Attribution (CC BY) : vous pouvez copier, partager, adapter et réutiliser ce contenu, y compris à des fins commerciales, à condition de citer statistics.wiki et d’indiquer les modifications apportées. Les sources citées ci-dessus peuvent avoir leurs propres conditions de licence.