
Burkina Faso vs Bénin : PIB, 1960–2025
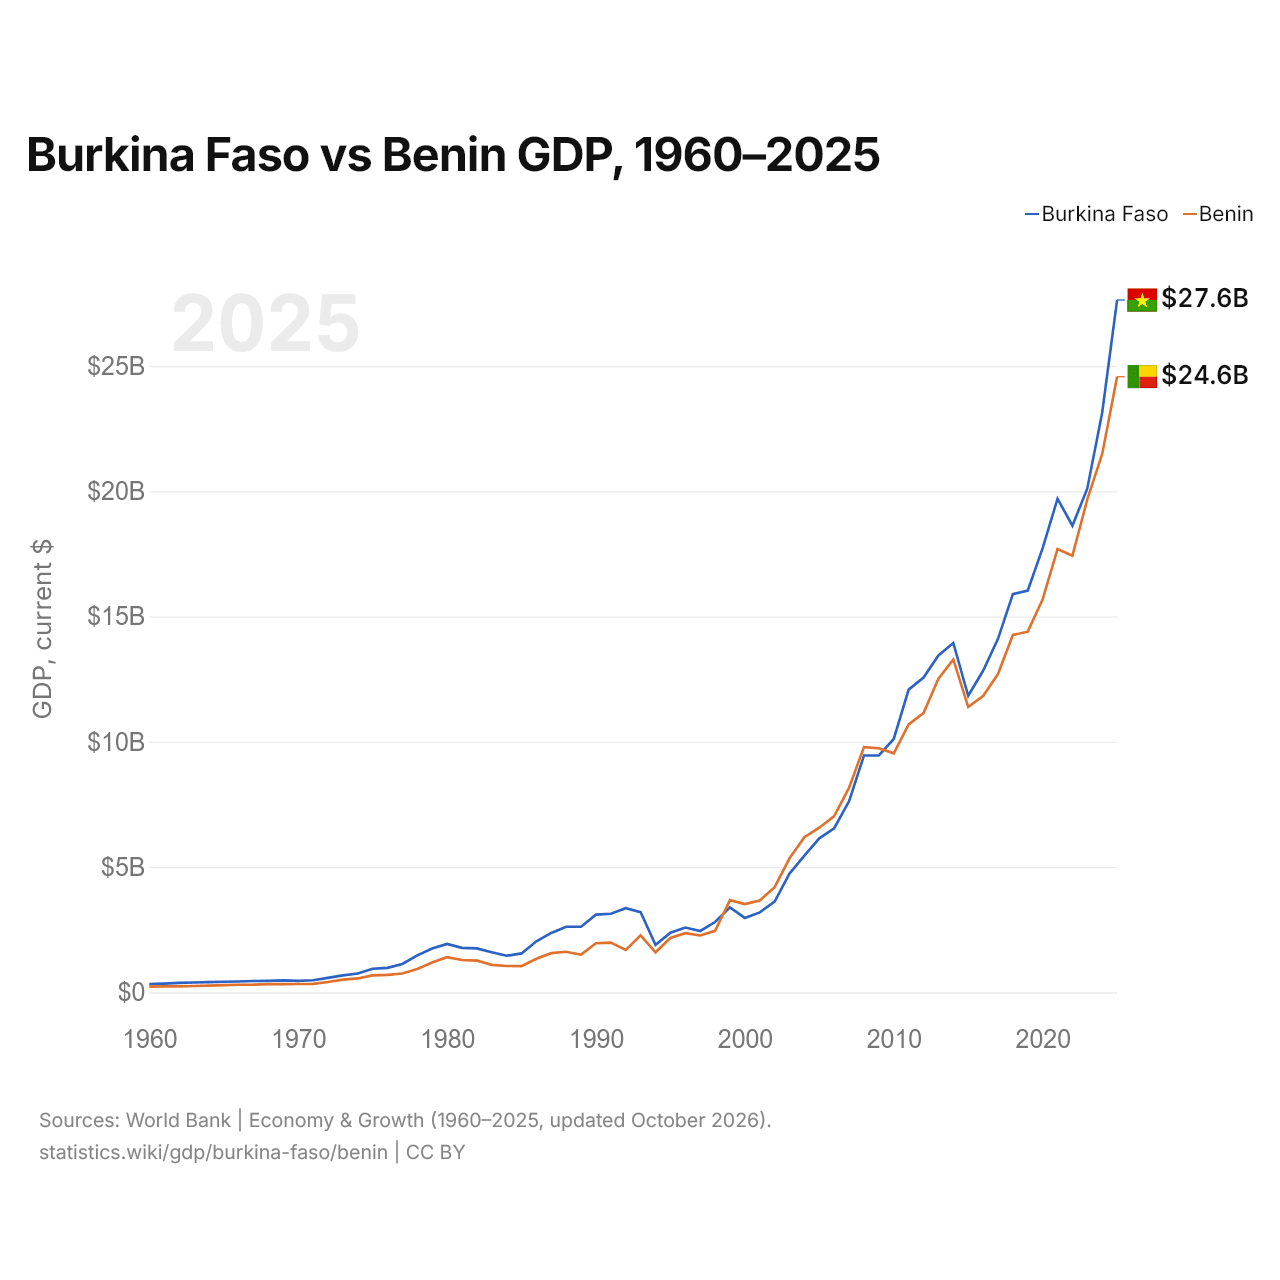
| Année | PIB, dollars US courants | |
|---|---|---|
 Burkina Faso |
 Bénin |
|
| 2025 | 27 627 297 461 $ US | 24 566 420 904 $ US |
| 2024 | 23 136 514 856 $ US | 21 482 643 706 $ US |
| 2023 | 20 106 062 972 $ US | 19 673 291 004 $ US |
| 2022 | 18 622 421 395 $ US | 17 425 405 091 $ US |
| 2021 | 19 697 516 284 $ US | 17 687 623 530 $ US |
| 2020 | 17 725 010 533 $ US | 15 686 741 884 $ US |
| 2019 | 16 032 813 503 $ US | 14 391 686 313 $ US |
| 2018 | 15 890 066 221 $ US | 14 262 408 090 $ US |
| 2017 | 14 106 955 615 $ US | 12 701 655 837 $ US |
| 2016 | 12 833 363 045 $ US | 11 821 065 853 $ US |
| 2015 | 11 832 159 316 $ US | 11 388 160 997 $ US |
| 2014 | 13 943 016 077 $ US | 13 284 527 847 $ US |
| 2013 | 13 444 300 486 $ US | 12 517 845 124 $ US |
| 2012 | 12 561 015 157 $ US | 11 141 358 116 $ US |
| 2011 | 12 080 295 978 $ US | 10 693 321 364 $ US |
| 2010 | 10 109 619 741 $ US | 9 535 345 016 $ US |
| 2009 | 9 450 696 873 $ US | 9 738 626 517 $ US |
| 2008 | 9 451 435 490 $ US | 9 787 734 526 $ US |
| 2007 | 7 625 722 837 $ US | 8 169 048 383 $ US |
| 2006 | 6 547 419 820 $ US | 7 034 111 315 $ US |
| 2005 | 6 146 353 173 $ US | 6 567 654 954 $ US |
| 2004 | 5 451 688 538 $ US | 6 190 270 380 $ US |
| 2003 | 4 740 768 143 $ US | 5 349 258 094 $ US |
| 2002 | 3 622 350 063 $ US | 4 194 342 686 $ US |
| 2001 | 3 190 371 081 $ US | 3 666 222 635 $ US |
| 2000 | 2 968 370 088 $ US | 3 519 991 440 $ US |
| 1999 | 3 389 566 713 $ US | 3 677 393 999 $ US |
| 1998 | 2 804 902 367 $ US | 2 455 092 686 $ US |
| 1997 | 2 447 669 102 $ US | 2 268 301 646 $ US |
| 1996 | 2 586 550 595 $ US | 2 361 116 449 $ US |
| 1995 | 2 379 517 975 $ US | 2 169 627 138 $ US |
| 1994 | 1 895 290 637 $ US | 1 598 075 944 $ US |
| 1993 | 3 199 536 465 $ US | 2 274 558 083 $ US |
| 1992 | 3 356 692 505 $ US | 1 695 315 306 $ US |
| 1991 | 3 135 045 584 $ US | 1 986 437 797 $ US |
| 1990 | 3 101 300 779 $ US | 1 959 965 330 $ US |
| 1989 | 2 615 587 734 $ US | 1 502 294 416 $ US |
| 1988 | 2 616 040 479 $ US | 1 620 246 084 $ US |
| 1987 | 2 369 834 950 $ US | 1 562 412 228 $ US |
| 1986 | 2 036 303 358 $ US | 1 336 102 025 $ US |
| 1985 | 1 552 493 196 $ US | 1 045 712 789 $ US |
| 1984 | 1 459 880 132 $ US | 1 051 134 009 $ US |
| 1983 | 1 600 278 605 $ US | 1 095 348 199 $ US |
| 1982 | 1 754 450 096 $ US | 1 267 778 670 $ US |
| 1981 | 1 775 842 334 $ US | 1 291 120 188 $ US |
| 1980 | 1 928 719 888 $ US | 1 405 251 847 $ US |
| 1979 | 1 748 480 621 $ US | 1 186 231 020 $ US |
| 1978 | 1 475 583 645 $ US | 928 843 469 $ US |
| 1977 | 1 131 224 878 $ US | 750 049 779 $ US |
| 1976 | 976 547 188 $ US | 698 408 262 $ US |
| 1975 | 939 972 703 $ US | 676 870 140 $ US |
| 1974 | 751 133 430 $ US | 554 654 861 $ US |
| 1973 | 674 773 570 $ US | 504 376 074 $ US |
| 1972 | 578 595 522 $ US | 410 331 857 $ US |
| 1971 | 482 411 179 $ US | 335 073 028 $ US |
| 1970 | 458 404 269 $ US | 333 627 713 $ US |
| 1969 | 478 298 645 $ US | 330 748 245 $ US |
| 1968 | 460 442 689 $ US | 326 323 105 $ US |
| 1967 | 450 753 924 $ US | 306 221 953 $ US |
| 1966 | 433 889 766 $ US | 302 925 235 $ US |
| 1965 | 422 916 790 $ US | 289 908 680 $ US |
| 1964 | 410 321 645 $ US | 269 819 006 $ US |
| 1963 | 394 040 667 $ US | 253 927 697 $ US |
| 1962 | 379 567 099 $ US | 236 434 954 $ US |
| 1961 | 350 247 234 $ US | 235 668 221 $ US |
| 1960 | 330 442 816 $ US | 226 195 578 $ US |
En 2025, le PIB du Burkina Faso (27,6 milliards de dollars US) était supérieur de 12 % à celui du Bénin (24,6 milliards de dollars US). En 2015, le PIB du Burkina Faso était à peu près égal à celui du Bénin. De 2015 à 2025, à prix constants de 2015, le PIB du Burkina Faso a progressé de 60,1 % et celui du Bénin de 81,8 %.
Depuis 2010, le PIB du Burkina Faso est le plus élevé des deux ; il l'était aussi en 1960, supérieur de 46 % à celui du Bénin. En 2025, le PIB par habitant était de 1 148 $ US au Burkina Faso et de 1 658 $ US au Bénin, soit 45 % de plus au Bénin.
Burkina Faso vs Bénin : derniers chiffres du PIB
|
Burkina Faso
|
Bénin
|
|
|---|---|---|
| PIB, dollars US courants | 27,6 Md $US | 24,6 Md $US |
| Rang mondial | 119/197 | 124/197 |
| Part mondiale | 0,02 % | 0,02 % |
| PIB, dollars US constants de 2015 | 18,9 Md $US | 20,7 Md $US |
| Écart de PIB | 1,1× | 0,89× |
Comparer le PIB de 2 pays au choix
Sources :
- Banque mondiale | Économie et croissance (1960–2025, mis à jour en octobre 2026)
Creative Commons Attribution (CC BY) : vous pouvez copier, partager, adapter et réutiliser ce contenu, y compris à des fins commerciales, à condition de citer statistics.wiki et d’indiquer les modifications apportées. Les sources citées ci-dessus peuvent avoir leurs propres conditions de licence.