
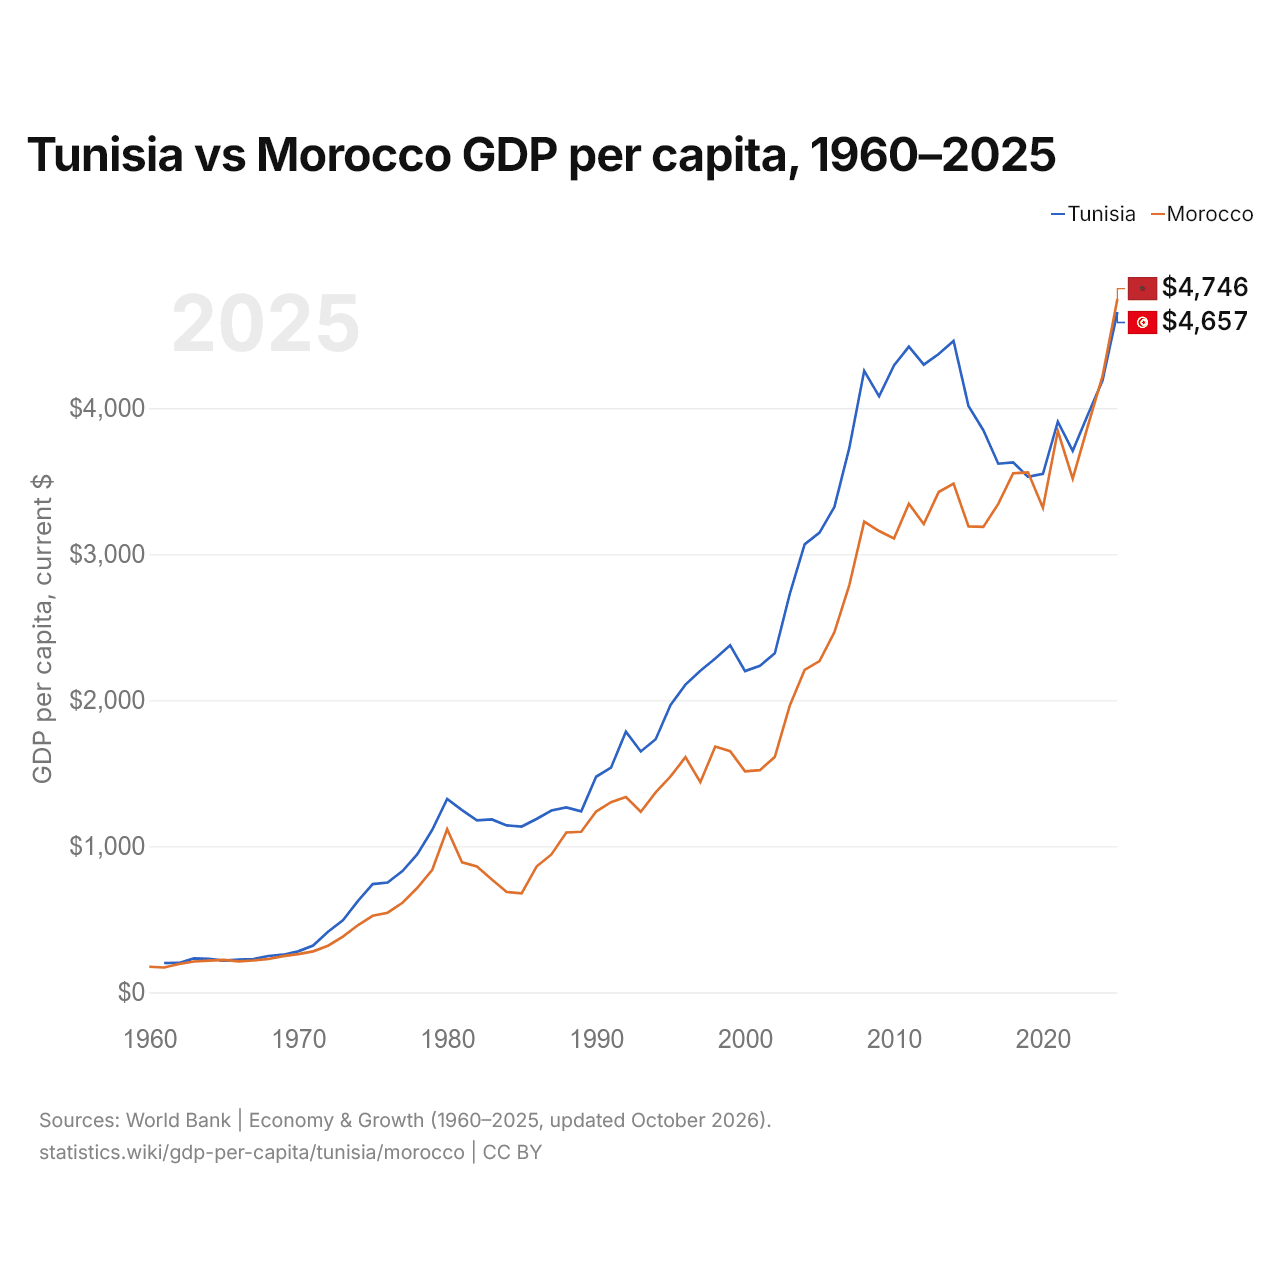
Tunisie vs Maroc : PIB par habitant, 1960–2025
| Année | PIB par habitant, dollars US courants | |
|---|---|---|
 Tunisie |
 Maroc |
|
| 2025 | 4 657 $ US | 4 746 $ US |
| 2024 | 4 188 $ US | 4 218 $ US |
| 2023 | 3 951 $ US | 3 872 $ US |
| 2022 | 3 707 $ US | 3 516 $ US |
| 2021 | 3 907 $ US | 3 843 $ US |
| 2020 | 3 549 $ US | 3 317 $ US |
| 2019 | 3 529 $ US | 3 560 $ US |
| 2018 | 3 628 $ US | 3 553 $ US |
| 2017 | 3 619 $ US | 3 344 $ US |
| 2016 | 3 848 $ US | 3 186 $ US |
| 2015 | 4 015 $ US | 3 190 $ US |
| 2014 | 4 459 $ US | 3 483 $ US |
| 2013 | 4 370 $ US | 3 425 $ US |
| 2012 | 4 297 $ US | 3 206 $ US |
| 2011 | 4 421 $ US | 3 345 $ US |
| 2010 | 4 292 $ US | 3 107 $ US |
| 2009 | 4 080 $ US | 3 158 $ US |
| 2008 | 4 255 $ US | 3 222 $ US |
| 2007 | 3 727 $ US | 2 788 $ US |
| 2006 | 3 323 $ US | 2 466 $ US |
| 2005 | 3 147 $ US | 2 268 $ US |
| 2004 | 3 067 $ US | 2 207 $ US |
| 2003 | 2 726 $ US | 1 962 $ US |
| 2002 | 2 321 $ US | 1 612 $ US |
| 2001 | 2 236 $ US | 1 521 $ US |
| 2000 | 2 199 $ US | 1 513 $ US |
| 1999 | 2 376 $ US | 1 651 $ US |
| 1998 | 2 285 $ US | 1 683 $ US |
| 1997 | 2 202 $ US | 1 439 $ US |
| 1996 | 2 107 $ US | 1 610 $ US |
| 1995 | 1 968 $ US | 1 478 $ US |
| 1994 | 1 733 $ US | 1 369 $ US |
| 1993 | 1 649 $ US | 1 236 $ US |
| 1992 | 1 785 $ US | 1 337 $ US |
| 1991 | 1 538 $ US | 1 302 $ US |
| 1990 | 1 476 $ US | 1 238 $ US |
| 1989 | 1 239 $ US | 1 099 $ US |
| 1988 | 1 266 $ US | 1 094 $ US |
| 1987 | 1 245 $ US | 944 $ US |
| 1986 | 1 187 $ US | 861 $ US |
| 1985 | 1 135 $ US | 678 $ US |
| 1984 | 1 143 $ US | 687 $ US |
| 1983 | 1 184 $ US | 772 $ US |
| 1982 | 1 177 $ US | 862 $ US |
| 1981 | 1 247 $ US | 890 $ US |
| 1980 | 1 324 $ US | 1 117 $ US |
| 1979 | 1 113 $ US | 839 $ US |
| 1978 | 946 $ US | 716 $ US |
| 1977 | 830 $ US | 613 $ US |
| 1976 | 752 $ US | 545 $ US |
| 1975 | 741 $ US | 524 $ US |
| 1974 | 624 $ US | 459 $ US |
| 1973 | 493 $ US | 382 $ US |
| 1972 | 415 $ US | 319 $ US |
| 1971 | 320 $ US | 280,6 $ US |
| 1970 | 280,5 $ US | 261,5 $ US |
| 1969 | 257,7 $ US | 247,8 $ US |
| 1968 | 248,9 $ US | 228 $ US |
| 1967 | 228 $ US | 218,1 $ US |
| 1966 | 223,8 $ US | 211,5 $ US |
| 1965 | 217,3 $ US | 222,7 $ US |
| 1964 | 228,5 $ US | 216,9 $ US |
| 1963 | 231,9 $ US | 211,3 $ US |
| 1962 | 201,4 $ US | 194,2 $ US |
| 1961 | 200,7 $ US | 169,8 $ US |
| 1960 | - | 175,2 $ US |
En 2025, le PIB par habitant était de 4 657 $ US en Tunisie et de 4 746 $ US au Maroc : 1,9 % de plus au Maroc. En 1961, il était de 201 $ US en Tunisie et de 170 $ US au Maroc, soit 18 % de plus en Tunisie.
À prix constants de 2015, le PIB par habitant de la Tunisie a été multiplié par 3,8 entre 1966 et 2025, et celui du Maroc par 4,4. En parité de pouvoir d'achat, l'ordre s'inverse : le PIB par habitant (PPA) est de 15 233 dollars en Tunisie et de 11 112 dollars au Maroc.
Tunisie vs Maroc : derniers chiffres du PIB par habitant
Comparer le PIB par habitant de 2 pays au choix
Sources :
- Banque mondiale | Économie et croissance (1960–2025, mis à jour en octobre 2026)
Creative Commons Attribution (CC BY) : vous pouvez copier, partager, adapter et réutiliser ce contenu, y compris à des fins commerciales, à condition de citer statistics.wiki et d’indiquer les modifications apportées. Les sources citées ci-dessus peuvent avoir leurs propres conditions de licence.