
Sénégal vs Mauritanie : PIB par habitant, 1960–2025
| Année | PIB par habitant, dollars US courants | |
|---|---|---|
 Sénégal |
 Mauritanie |
|
| 2025 | 1 955 $ US | 2 198 $ US |
| 2024 | 1 739 $ US | 2 105 $ US |
| 2023 | 1 698 $ US | 2 128 $ US |
| 2022 | 1 574 $ US | 1 961 $ US |
| 2021 | 1 598 $ US | 1 947 $ US |
| 2020 | 1 461 $ US | 1 796 $ US |
| 2019 | 1 431 $ US | 1 767 $ US |
| 2018 | 1 453 $ US | 1 723 $ US |
| 2017 | 1 355 $ US | 1 618 $ US |
| 2016 | 1 266 $ US | 1 568 $ US |
| 2015 | 1 218 $ US | 1 559 $ US |
| 2014 | 1 399 $ US | 1 719 $ US |
| 2013 | 1 380 $ US | 1 936 $ US |
| 2012 | 1 327 $ US | 1 859 $ US |
| 2011 | 1 375 $ US | 1 931 $ US |
| 2010 | 1 276 $ US | 1 660 $ US |
| 2009 | 1 309 $ US | 1 435 $ US |
| 2008 | 1 399 $ US | 1 636 $ US |
| 2007 | 1 189 $ US | 1 405 $ US |
| 2006 | 1 017 $ US | 1 301 $ US |
| 2005 | 980 $ US | 999 $ US |
| 2004 | 918 $ US | 824 $ US |
| 2003 | 818 $ US | 732 $ US |
| 2002 | 669 $ US | 649 $ US |
| 2001 | 637 $ US | 652 $ US |
| 2000 | 603 $ US | 681 $ US |
| 1999 | 678 $ US | 781 $ US |
| 1998 | 685 $ US | 821 $ US |
| 1997 | 651 $ US | 859 $ US |
| 1996 | 723 $ US | 904 $ US |
| 1995 | 715 $ US | 905 $ US |
| 1994 | 584 $ US | 865 $ US |
| 1993 | 878 $ US | 850 $ US |
| 1992 | 951 $ US | 1 036 $ US |
| 1991 | 913 $ US | 1 062 $ US |
| 1990 | 957 $ US | 772 $ US |
| 1989 | 849 $ US | 762 $ US |
| 1988 | 880 $ US | 762 $ US |
| 1987 | 916 $ US | 746 $ US |
| 1986 | 784 $ US | 677 $ US |
| 1985 | 571 $ US | 593 $ US |
| 1984 | 536 $ US | 650 $ US |
| 1983 | 564 $ US | 725 $ US |
| 1982 | 652 $ US | 710 $ US |
| 1981 | 683 $ US | 729 $ US |
| 1980 | 772 $ US | 711 $ US |
| 1979 | 716 $ US | 664 $ US |
| 1978 | 589 $ US | 578 $ US |
| 1977 | 540 $ US | 590 $ US |
| 1976 | 541 $ US | 589 $ US |
| 1975 | 547 $ US | 551 $ US |
| 1974 | 417 $ US | 494 $ US |
| 1973 | 381 $ US | 410 $ US |
| 1972 | 342 $ US | 335 $ US |
| 1971 | 291,1 $ US | 296 $ US |
| 1970 | 290,5 $ US | 281,3 $ US |
| 1969 | 287,3 $ US | 276,6 $ US |
| 1968 | 311 $ US | 301 $ US |
| 1967 | 305 $ US | 281,5 $ US |
| 1966 | 315 $ US | 273,6 $ US |
| 1965 | 314 $ US | 270 $ US |
| 1964 | 318 $ US | 244,3 $ US |
| 1963 | 309 $ US | 188,2 $ US |
| 1962 | 307 $ US | 189 $ US |
| 1961 | 308 $ US | 188,2 $ US |
| 1960 | 300 $ US | - |
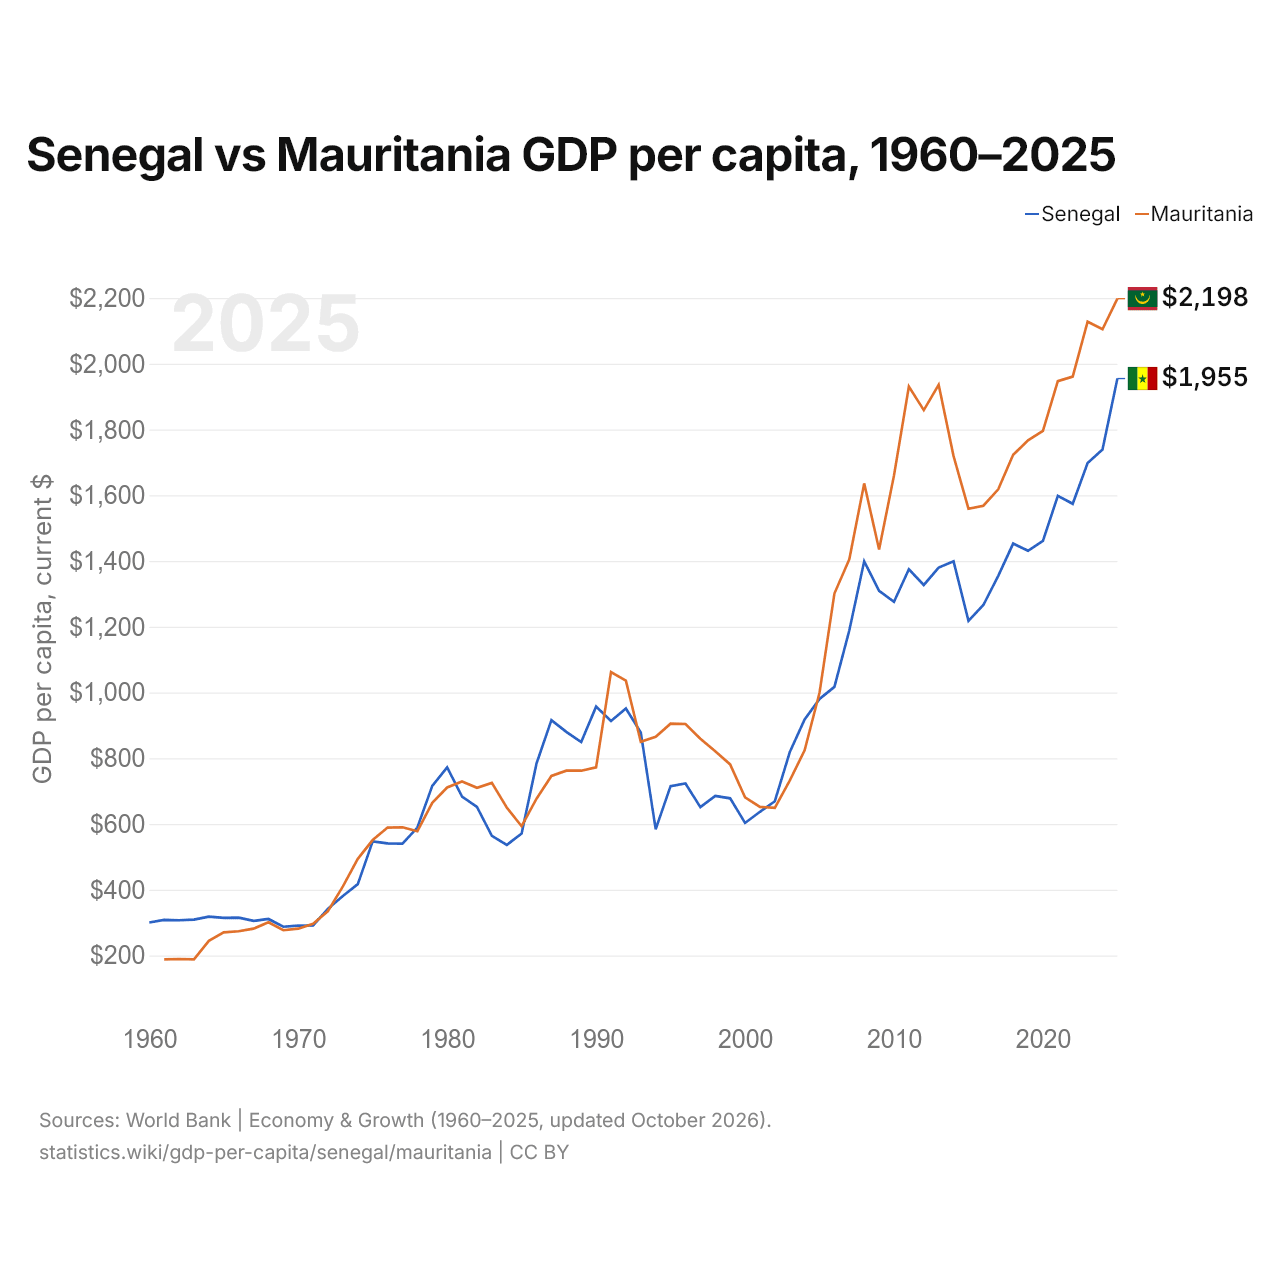
En 2025, le PIB par habitant était de 1 955 $ US au Sénégal et de 2 198 $ US en Mauritanie : 12 % de plus en Mauritanie. En 1961, il était de 308 $ US au Sénégal et de 188 $ US en Mauritanie, soit 1,6 fois plus au Sénégal.
Le PIB par habitant de la Mauritanie est plus élevé que celui du Sénégal chaque année depuis 2005. À prix constants de 2015, entre 1961 et 2025, le PIB par habitant du Sénégal a progressé de 37 %, et celui de la Mauritanie a progressé de 36 %.
Sénégal vs Mauritanie : derniers chiffres du PIB par habitant
|
Sénégal
|
Mauritanie
|
|
|---|---|---|
| PIB par habitant, dollars US courants | 1 955 $US | 2 198 $US |
| Rang mondial | 160/197 | 156/197 |
| PIB par habitant, dollars US constants de 2015 | 1 582 $US | 1 713 $US |
| × moyenne mondiale | 0,14× | 0,15× |
| Écart de PIB par habitant | 0,89× | 1,1× |
Comparer le PIB par habitant de 2 pays au choix
Sources :
- Banque mondiale | Économie et croissance (1960–2025, mis à jour en octobre 2026)
Creative Commons Attribution (CC BY) : vous pouvez copier, partager, adapter et réutiliser ce contenu, y compris à des fins commerciales, à condition de citer statistics.wiki et d’indiquer les modifications apportées. Les sources citées ci-dessus peuvent avoir leurs propres conditions de licence.