
Philippines vs Nigeria : PIB par habitant, 1960–2025
| Année | PIB par habitant, dollars US courants | |
|---|---|---|
 Philippines |
 Nigeria |
|
| 2025 | 4 171 $ US | 1 224 $ US |
| 2024 | 3 985 $ US | 1 084 $ US |
| 2023 | 3 804 $ US | 2 139 $ US |
| 2022 | 3 548 $ US | 2 899 $ US |
| 2021 | 3 484 $ US | 2 787 $ US |
| 2020 | 3 228 $ US | 2 797 $ US |
| 2019 | 3 401 $ US | 3 190 $ US |
| 2018 | 3 169 $ US | 2 058 $ US |
| 2017 | 3 038 $ US | 1 876 $ US |
| 2016 | 2 985 $ US | 2 070 $ US |
| 2015 | 2 910 $ US | 2 586 $ US |
| 2014 | 2 867 $ US | 3 089 $ US |
| 2013 | 2 781 $ US | 2 873 $ US |
| 2012 | 2 615 $ US | 2 633 $ US |
| 2011 | 2 384 $ US | 2 418 $ US |
| 2010 | 2 163 $ US | 2 202 $ US |
| 2009 | 1 864 $ US | 1 820 $ US |
| 2008 | 1 959 $ US | 2 154 $ US |
| 2007 | 1 713 $ US | 1 816 $ US |
| 2006 | 1 426 $ US | 1 600 $ US |
| 2005 | 1 220 $ US | 1 211 $ US |
| 2004 | 1 100 $ US | 962 $ US |
| 2003 | 1 027 $ US | 763 $ US |
| 2002 | 1 015 $ US | 712 $ US |
| 2001 | 970 $ US | 566 $ US |
| 2000 | 1 051 $ US | 547 $ US |
| 1999 | 1 101 $ US | 481 $ US |
| 1998 | 983 $ US | 1 822 $ US |
| 1997 | 1 273 $ US | 1 720 $ US |
| 1996 | 1 311 $ US | 1 633 $ US |
| 1995 | 1 200 $ US | 1 272 $ US |
| 1994 | 1 060 $ US | 745 $ US |
| 1993 | 919 $ US | 540 $ US |
| 1992 | 917 $ US | 509 $ US |
| 1991 | 804 $ US | 597 $ US |
| 1990 | 804 $ US | 556 $ US |
| 1989 | 792 $ US | 465 $ US |
| 1988 | 722 $ US | 540 $ US |
| 1987 | 650 $ US | 588 $ US |
| 1986 | 600 $ US | 628 $ US |
| 1985 | 633 $ US | 869 $ US |
| 1984 | 665 $ US | 890 $ US |
| 1983 | 723 $ US | 1 207 $ US |
| 1982 | 833 $ US | 1 822 $ US |
| 1981 | 821 $ US | 2 162 $ US |
| 1980 | 767 $ US | 870 $ US |
| 1979 | 667 $ US | 661 $ US |
| 1978 | 565 $ US | 527 $ US |
| 1977 | 502 $ US | 536 $ US |
| 1976 | 449 $ US | 556 $ US |
| 1975 | 401 $ US | 438 $ US |
| 1974 | 379 $ US | 403 $ US |
| 1973 | 283,2 $ US | 252,4 $ US |
| 1972 | 230,1 $ US | 209,5 $ US |
| 1971 | 217,4 $ US | 160,5 $ US |
| 1970 | 200,9 $ US | 224,5 $ US |
| 1969 | 261,1 $ US | 121,4 $ US |
| 1968 | 242,2 $ US | 97,3 $ US |
| 1967 | 223,1 $ US | 99,5 $ US |
| 1966 | 213,8 $ US | 124,4 $ US |
| 1965 | 199,8 $ US | 117,3 $ US |
| 1964 | 188,2 $ US | 113,3 $ US |
| 1963 | 179,5 $ US | 107,7 $ US |
| 1962 | 166,7 $ US | 104,5 $ US |
| 1961 | 283,8 $ US | 97,1 $ US |
| 1960 | 269,5 $ US | 93,1 $ US |
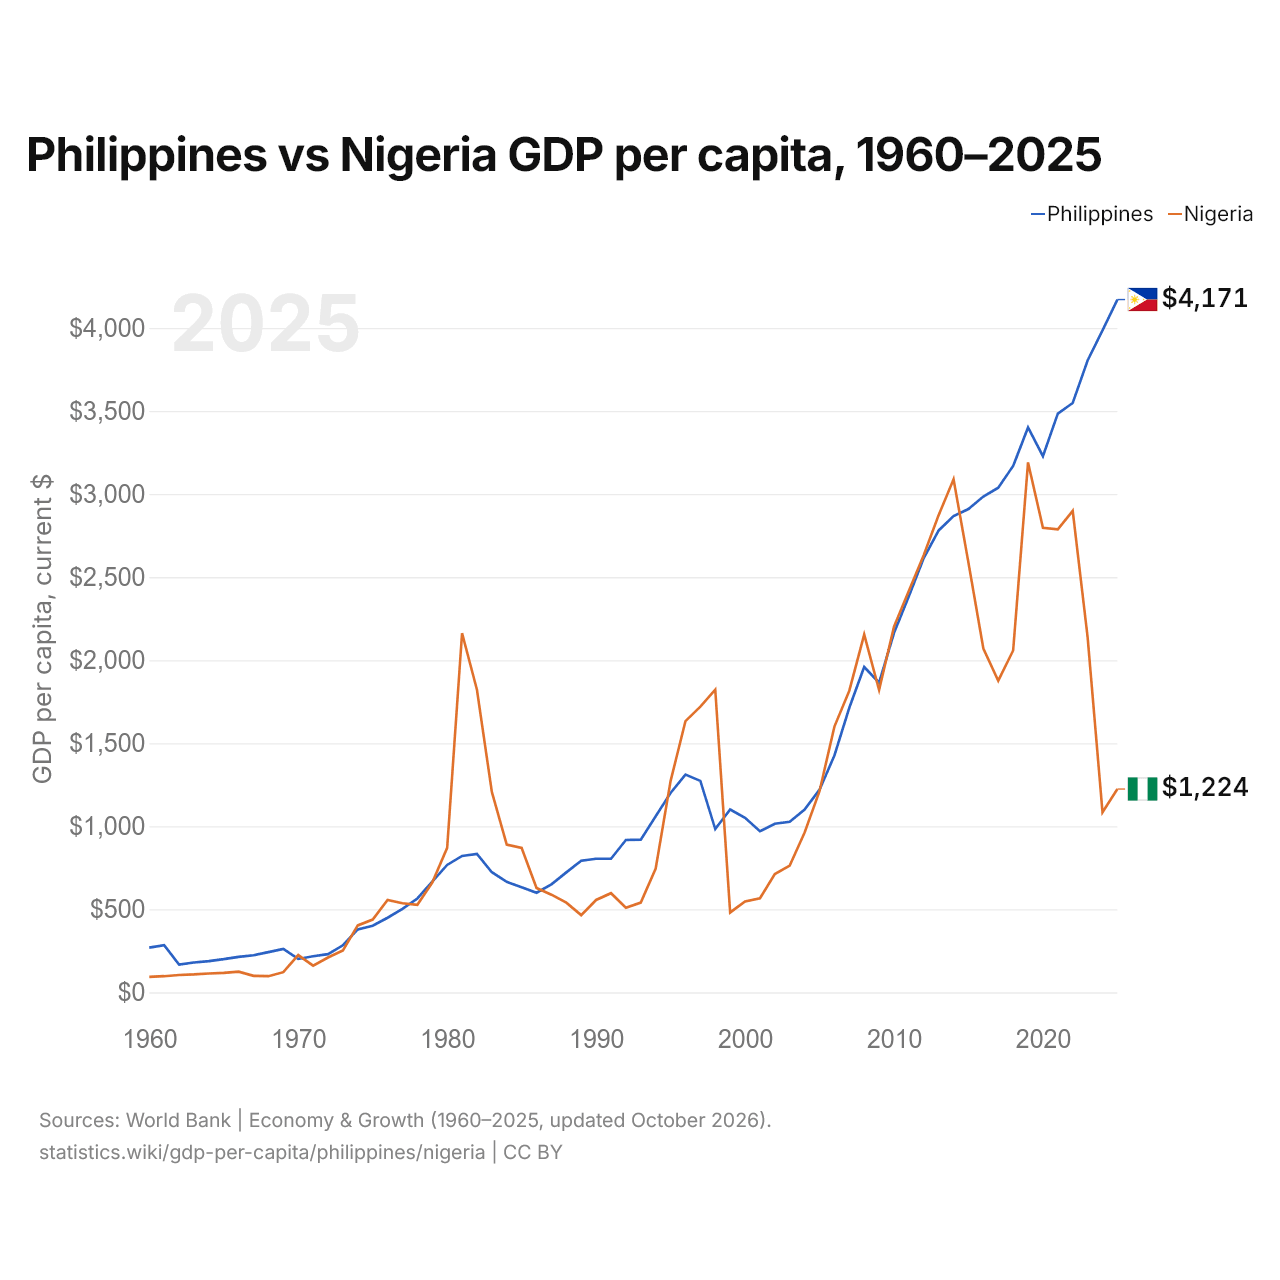
En 2025, le PIB par habitant était de 4 171 $ US aux Philippines et de 1 224 $ US au Nigeria : 3,4 fois plus élevé aux Philippines. En 1960, il était de 269 $ US aux Philippines et de 93 $ US au Nigeria, soit 2,9 fois plus aux Philippines.
Le PIB par habitant des Philippines est plus élevé que celui du Nigeria chaque année depuis 2015. À prix constants de 2015, le PIB par habitant des Philippines a été multiplié par 3,6 entre 1960 et 2025, et celui du Nigeria par 1,6.
Philippines vs Nigeria : derniers chiffres du PIB par habitant
|
Philippines
|
Nigeria
|
|
|---|---|---|
| PIB par habitant, dollars US courants | 4 171 $US | 1 224 $US |
| Rang mondial | 130/197 | 172/197 |
| PIB par habitant, dollars US constants de 2015 | 4 066 $US | 2 369 $US |
| × moyenne mondiale | 0,29× | 0,08× |
| Écart de PIB par habitant | 3,4× | 0,29× |
Comparer le PIB par habitant de 2 pays au choix
Sources :
- Banque mondiale | Économie et croissance (1960–2025, mis à jour en octobre 2026)
Creative Commons Attribution (CC BY) : vous pouvez copier, partager, adapter et réutiliser ce contenu, y compris à des fins commerciales, à condition de citer statistics.wiki et d’indiquer les modifications apportées. Les sources citées ci-dessus peuvent avoir leurs propres conditions de licence.