
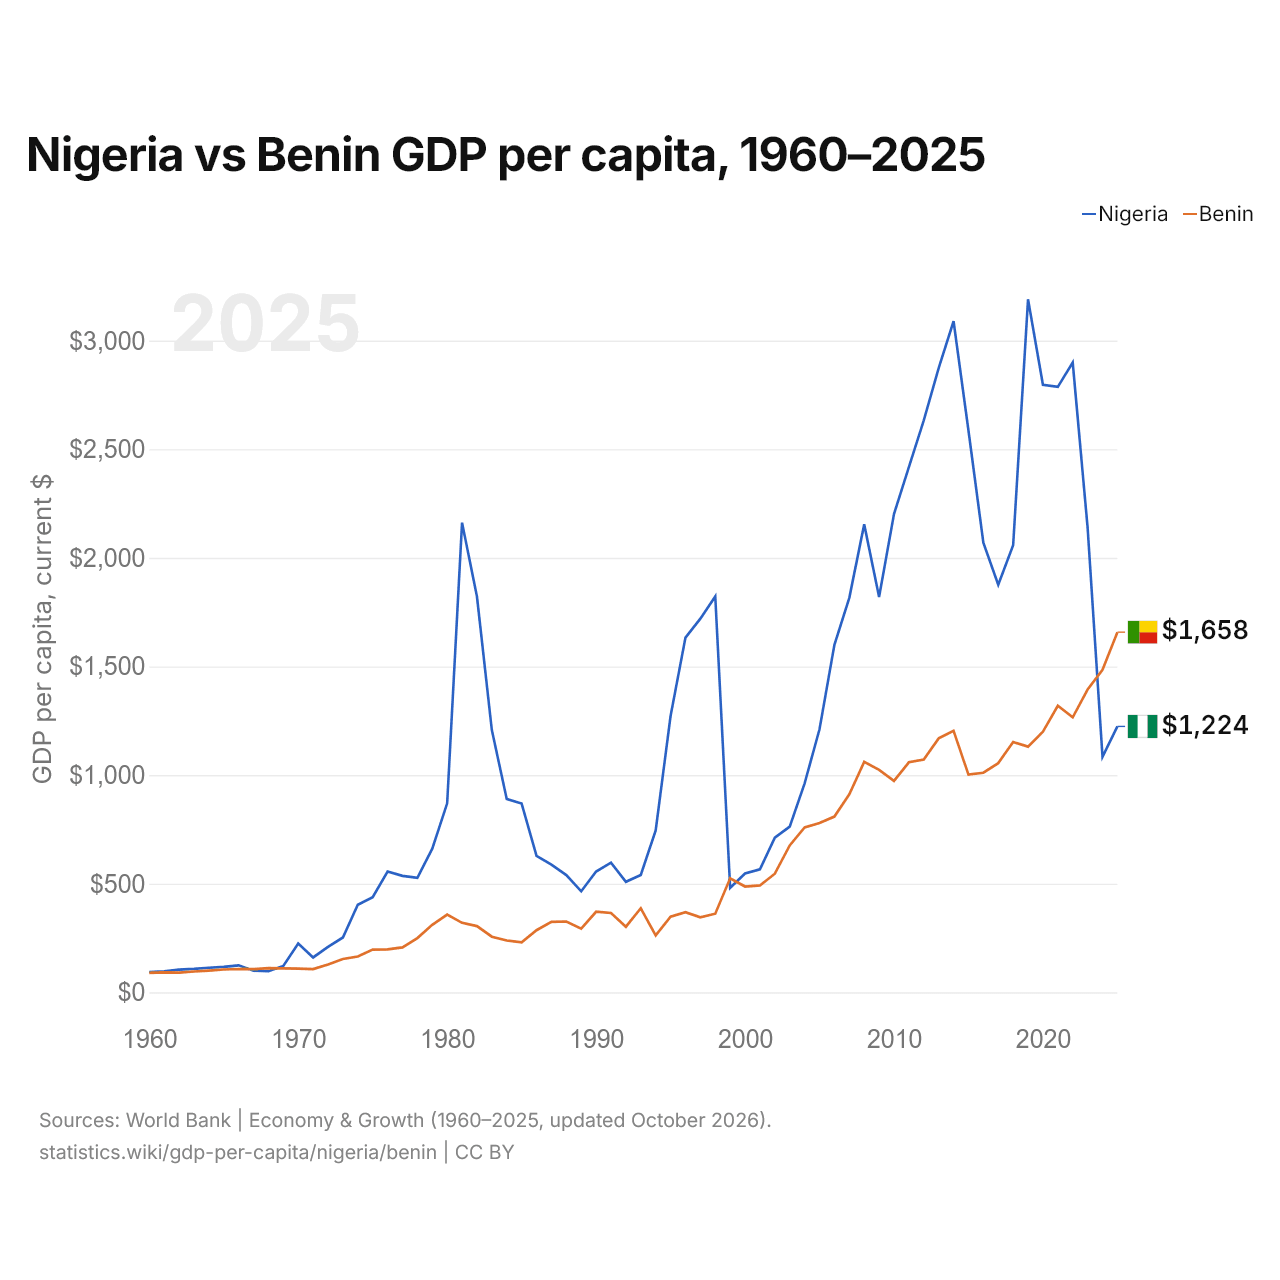
Nigeria vs Bénin : PIB par habitant, 1960–2025
| Année | PIB par habitant, dollars US courants | |
|---|---|---|
 Nigeria |
 Bénin |
|
| 2025 | 1 224 $ US | 1 658 $ US |
| 2024 | 1 084 $ US | 1 485 $ US |
| 2023 | 2 139 $ US | 1 394 $ US |
| 2022 | 2 899 $ US | 1 266 $ US |
| 2021 | 2 787 $ US | 1 319 $ US |
| 2020 | 2 797 $ US | 1 200 $ US |
| 2019 | 3 190 $ US | 1 131 $ US |
| 2018 | 2 058 $ US | 1 152 $ US |
| 2017 | 1 876 $ US | 1 055 $ US |
| 2016 | 2 070 $ US | 1 011 $ US |
| 2015 | 2 586 $ US | 1 002 $ US |
| 2014 | 3 089 $ US | 1 204 $ US |
| 2013 | 2 873 $ US | 1 169 $ US |
| 2012 | 2 633 $ US | 1 072 $ US |
| 2011 | 2 418 $ US | 1 059 $ US |
| 2010 | 2 202 $ US | 973 $ US |
| 2009 | 1 820 $ US | 1 024 $ US |
| 2008 | 2 154 $ US | 1 061 $ US |
| 2007 | 1 816 $ US | 912 $ US |
| 2006 | 1 600 $ US | 809 $ US |
| 2005 | 1 211 $ US | 779 $ US |
| 2004 | 962 $ US | 759 $ US |
| 2003 | 763 $ US | 676 $ US |
| 2002 | 712 $ US | 546 $ US |
| 2001 | 566 $ US | 492 $ US |
| 2000 | 547 $ US | 487 $ US |
| 1999 | 481 $ US | 525 $ US |
| 1998 | 1 822 $ US | 362 $ US |
| 1997 | 1 720 $ US | 345 $ US |
| 1996 | 1 633 $ US | 369 $ US |
| 1995 | 1 272 $ US | 348 $ US |
| 1994 | 745 $ US | 262,1 $ US |
| 1993 | 540 $ US | 387 $ US |
| 1992 | 509 $ US | 302 $ US |
| 1991 | 597 $ US | 365 $ US |
| 1990 | 556 $ US | 371 $ US |
| 1989 | 465 $ US | 293,3 $ US |
| 1988 | 540 $ US | 326 $ US |
| 1987 | 588 $ US | 324 $ US |
| 1986 | 628 $ US | 285,8 $ US |
| 1985 | 869 $ US | 230,4 $ US |
| 1984 | 890 $ US | 238,6 $ US |
| 1983 | 1 207 $ US | 256 $ US |
| 1982 | 1 822 $ US | 305 $ US |
| 1981 | 2 162 $ US | 320 $ US |
| 1980 | 870 $ US | 358 $ US |
| 1979 | 661 $ US | 311 $ US |
| 1978 | 527 $ US | 249,8 $ US |
| 1977 | 536 $ US | 207 $ US |
| 1976 | 556 $ US | 197,7 $ US |
| 1975 | 438 $ US | 196,5 $ US |
| 1974 | 403 $ US | 164,9 $ US |
| 1973 | 252,4 $ US | 153,6 $ US |
| 1972 | 209,5 $ US | 127,9 $ US |
| 1971 | 160,5 $ US | 106,9 $ US |
| 1970 | 224,5 $ US | 108,8 $ US |
| 1969 | 121,4 $ US | 110,3 $ US |
| 1968 | 97,3 $ US | 111,2 $ US |
| 1967 | 99,5 $ US | 106,6 $ US |
| 1966 | 124,4 $ US | 107,6 $ US |
| 1965 | 117,3 $ US | 105,1 $ US |
| 1964 | 113,3 $ US | 99,8 $ US |
| 1963 | 107,7 $ US | 95,7 $ US |
| 1962 | 104,5 $ US | 90,8 $ US |
| 1961 | 97,1 $ US | 92,1 $ US |
| 1960 | 93,1 $ US | 89,9 $ US |
En 2025, le PIB par habitant était de 1 224 $ US au Nigeria et de 1 658 $ US au Bénin : 35 % de plus au Bénin. En 1960, il était de 93 $ US au Nigeria et de 90 $ US au Bénin, soit 3,7 % de plus au Nigeria.
À prix constants de 2015, le PIB par habitant du Nigeria a été multiplié par 1,6 entre 1960 et 2025, et celui du Bénin par 2,1. En parité de pouvoir d'achat, l'ordre s'inverse : le PIB par habitant (PPA) est de 9 532 dollars au Nigeria et de 4 817 dollars au Bénin.
Nigeria vs Bénin : derniers chiffres du PIB par habitant
Comparer le PIB par habitant de 2 pays au choix
Sources :
- Banque mondiale | Économie et croissance (1960–2025, mis à jour en octobre 2026)
Creative Commons Attribution (CC BY) : vous pouvez copier, partager, adapter et réutiliser ce contenu, y compris à des fins commerciales, à condition de citer statistics.wiki et d’indiquer les modifications apportées. Les sources citées ci-dessus peuvent avoir leurs propres conditions de licence.