
Pérou vs Mexique : PIB par habitant, 1960–2025
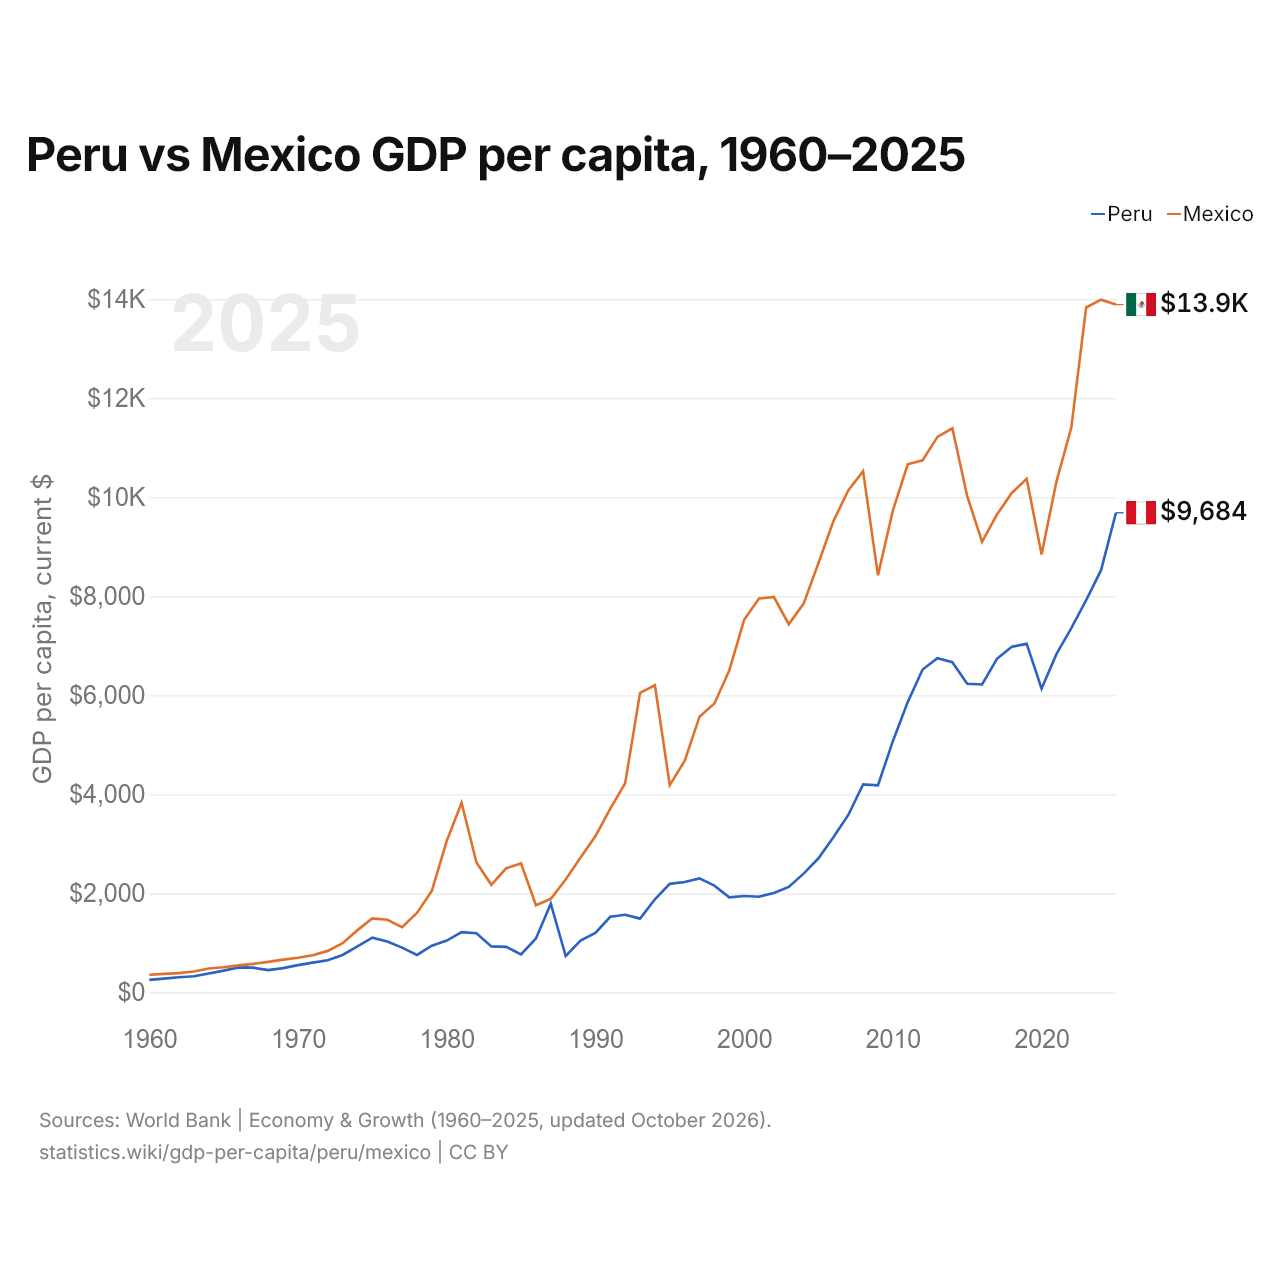
| Année | PIB par habitant, dollars US courants | |
|---|---|---|
 Pérou |
 Mexique |
|
| 2025 | 9 684 $ US | 13 889 $ US |
| 2024 | 8 526 $ US | 13 988 $ US |
| 2023 | 7 919 $ US | 13 831 $ US |
| 2022 | 7 354 $ US | 11 406 $ US |
| 2021 | 6 829 $ US | 10 314 $ US |
| 2020 | 6 133 $ US | 8 841 $ US |
| 2019 | 7 037 $ US | 10 370 $ US |
| 2018 | 6 978 $ US | 10 085 $ US |
| 2017 | 6 736 $ US | 9 649 $ US |
| 2016 | 6 217 $ US | 9 098 $ US |
| 2015 | 6 232 $ US | 10 021 $ US |
| 2014 | 6 667 $ US | 11 391 $ US |
| 2013 | 6 747 $ US | 11 217 $ US |
| 2012 | 6 519 $ US | 10 744 $ US |
| 2011 | 5 861 $ US | 10 664 $ US |
| 2010 | 5 072 $ US | 9 729 $ US |
| 2009 | 4 181 $ US | 8 424 $ US |
| 2008 | 4 198 $ US | 10 524 $ US |
| 2007 | 3 581 $ US | 10 134 $ US |
| 2006 | 3 130 $ US | 9 513 $ US |
| 2005 | 2 707 $ US | 8 672 $ US |
| 2004 | 2 397 $ US | 7 850 $ US |
| 2003 | 2 129 $ US | 7 434 $ US |
| 2002 | 2 007 $ US | 7 983 $ US |
| 2001 | 1 930 $ US | 7 953 $ US |
| 2000 | 1 945 $ US | 7 524 $ US |
| 1999 | 1 917 $ US | 6 500 $ US |
| 1998 | 2 156 $ US | 5 833 $ US |
| 1997 | 2 301 $ US | 5 567 $ US |
| 1996 | 2 227 $ US | 4 674 $ US |
| 1995 | 2 190 $ US | 4 184 $ US |
| 1994 | 1 879 $ US | 6 202 $ US |
| 1993 | 1 488 $ US | 6 048 $ US |
| 1992 | 1 567 $ US | 4 221 $ US |
| 1991 | 1 527 $ US | 3 709 $ US |
| 1990 | 1 200 $ US | 3 154 $ US |
| 1989 | 1 045 $ US | 2 725 $ US |
| 1988 | 733 $ US | 2 279 $ US |
| 1987 | 1 792 $ US | 1 888 $ US |
| 1986 | 1 087 $ US | 1 757 $ US |
| 1985 | 767 $ US | 2 602 $ US |
| 1984 | 918 $ US | 2 506 $ US |
| 1983 | 927 $ US | 2 170 $ US |
| 1982 | 1 194 $ US | 2 621 $ US |
| 1981 | 1 216 $ US | 3 829 $ US |
| 1980 | 1 045 $ US | 3 055 $ US |
| 1979 | 942 $ US | 2 049 $ US |
| 1978 | 756 $ US | 1 604 $ US |
| 1977 | 903 $ US | 1 315 $ US |
| 1976 | 1 026 $ US | 1 465 $ US |
| 1975 | 1 104 $ US | 1 492 $ US |
| 1974 | 927 $ US | 1 256 $ US |
| 1973 | 754 $ US | 993 $ US |
| 1972 | 647 $ US | 837 $ US |
| 1971 | 599 $ US | 748 $ US |
| 1970 | 550 $ US | 699 $ US |
| 1969 | 488 $ US | 660 $ US |
| 1968 | 448 $ US | 616 $ US |
| 1967 | 498 $ US | 576 $ US |
| 1966 | 505 $ US | 545 $ US |
| 1965 | 439 $ US | 506 $ US |
| 1964 | 381 $ US | 481 $ US |
| 1963 | 324 $ US | 420 $ US |
| 1962 | 305 $ US | 388 $ US |
| 1961 | 276,6 $ US | 374 $ US |
| 1960 | 252,8 $ US | 355 $ US |
En 2025, le PIB par habitant était de 9 684 $ US au Pérou et de 13 889 $ US au Mexique : 43 % de plus au Mexique. En 1960, il était de 253 $ US au Pérou et de 355 $ US au Mexique, soit 40 % de plus au Mexique.
Le PIB par habitant du Mexique est plus élevé que celui du Pérou chaque année depuis 1960. À prix constants de 2015, le PIB par habitant du Pérou a été multiplié par 2,5 entre 1960 et 2025, et celui du Mexique par 2,5.
Pérou vs Mexique : derniers chiffres du PIB par habitant
|
Pérou
|
Mexique
|
|
|---|---|---|
| PIB par habitant, dollars US courants | 9 684 $US | 13 889 $US |
| Rang mondial | 90/197 | 76/197 |
| PIB par habitant, dollars US constants de 2015 | 6 891 $US | 10 257 $US |
| × moyenne mondiale | 0,67× | 0,96× |
| Écart de PIB par habitant | 0,7× | 1,4× |
Comparer le PIB par habitant de 2 pays au choix
Sources :
- Banque mondiale | Économie et croissance (1960–2025, mis à jour en octobre 2026)
Creative Commons Attribution (CC BY) : vous pouvez copier, partager, adapter et réutiliser ce contenu, y compris à des fins commerciales, à condition de citer statistics.wiki et d’indiquer les modifications apportées. Les sources citées ci-dessus peuvent avoir leurs propres conditions de licence.