
Mexique vs Italie : PIB par habitant, 1960–2025
| Année | PIB par habitant, dollars US courants | |
|---|---|---|
 Mexique |
 Italie |
|
| 2025 | 13 889 $ US | 43 309 $ US |
| 2024 | 13 988 $ US | 40 430 $ US |
| 2023 | 13 831 $ US | 39 280 $ US |
| 2022 | 11 406 $ US | 35 654 $ US |
| 2021 | 10 314 $ US | 36 853 $ US |
| 2020 | 8 841 $ US | 32 091 $ US |
| 2019 | 10 370 $ US | 33 813 $ US |
| 2018 | 10 085 $ US | 35 062 $ US |
| 2017 | 9 649 $ US | 32 844 $ US |
| 2016 | 9 098 $ US | 31 392 $ US |
| 2015 | 10 021 $ US | 30 640 $ US |
| 2014 | 11 391 $ US | 36 028 $ US |
| 2013 | 11 217 $ US | 35 702 $ US |
| 2012 | 10 744 $ US | 34 854 $ US |
| 2011 | 10 664 $ US | 38 432 $ US |
| 2010 | 9 729 $ US | 35 857 $ US |
| 2009 | 8 424 $ US | 37 100 $ US |
| 2008 | 10 524 $ US | 40 829 $ US |
| 2007 | 10 134 $ US | 37 826 $ US |
| 2006 | 9 513 $ US | 33 537 $ US |
| 2005 | 8 672 $ US | 32 063 $ US |
| 2004 | 7 850 $ US | 31 348 $ US |
| 2003 | 7 434 $ US | 27 578 $ US |
| 2002 | 7 983 $ US | 22 451 $ US |
| 2001 | 7 953 $ US | 20 570 $ US |
| 2000 | 7 524 $ US | 20 190 $ US |
| 1999 | 6 500 $ US | 22 050 $ US |
| 1998 | 5 833 $ US | 22 365 $ US |
| 1997 | 5 567 $ US | 21 884 $ US |
| 1996 | 4 674 $ US | 23 123 $ US |
| 1995 | 4 184 $ US | 20 712 $ US |
| 1994 | 6 202 $ US | 19 382 $ US |
| 1993 | 6 048 $ US | 18 782 $ US |
| 1992 | 4 221 $ US | 23 297 $ US |
| 1991 | 3 709 $ US | 22 007 $ US |
| 1990 | 3 154 $ US | 20 874 $ US |
| 1989 | 2 725 $ US | 16 424 $ US |
| 1988 | 2 279 $ US | 15 781 $ US |
| 1987 | 1 888 $ US | 14 268 $ US |
| 1986 | 1 757 $ US | 11 341 $ US |
| 1985 | 2 602 $ US | 8 009 $ US |
| 1984 | 2 506 $ US | 7 758 $ US |
| 1983 | 2 170 $ US | 7 851 $ US |
| 1982 | 2 621 $ US | 7 574 $ US |
| 1981 | 3 829 $ US | 7 640 $ US |
| 1980 | 3 055 $ US | 8 476 $ US |
| 1979 | 2 049 $ US | 7 006 $ US |
| 1978 | 1 604 $ US | 5 623 $ US |
| 1977 | 1 315 $ US | 4 614 $ US |
| 1976 | 1 465 $ US | 4 042 $ US |
| 1975 | 1 492 $ US | 4 116 $ US |
| 1974 | 1 256 $ US | 3 629 $ US |
| 1973 | 993 $ US | 3 213 $ US |
| 1972 | 837 $ US | 2 677 $ US |
| 1971 | 748 $ US | 2 311 $ US |
| 1970 | 699 $ US | 2 112 $ US |
| 1969 | 660 $ US | 1 886 $ US |
| 1968 | 616 $ US | 1 718 $ US |
| 1967 | 576 $ US | 1 595 $ US |
| 1966 | 545 $ US | 1 459 $ US |
| 1965 | 506 $ US | 1 357 $ US |
| 1964 | 481 $ US | 1 272 $ US |
| 1963 | 420 $ US | 1 171 $ US |
| 1962 | 388 $ US | 1 030 $ US |
| 1961 | 374 $ US | 923 $ US |
| 1960 | 355 $ US | 837 $ US |
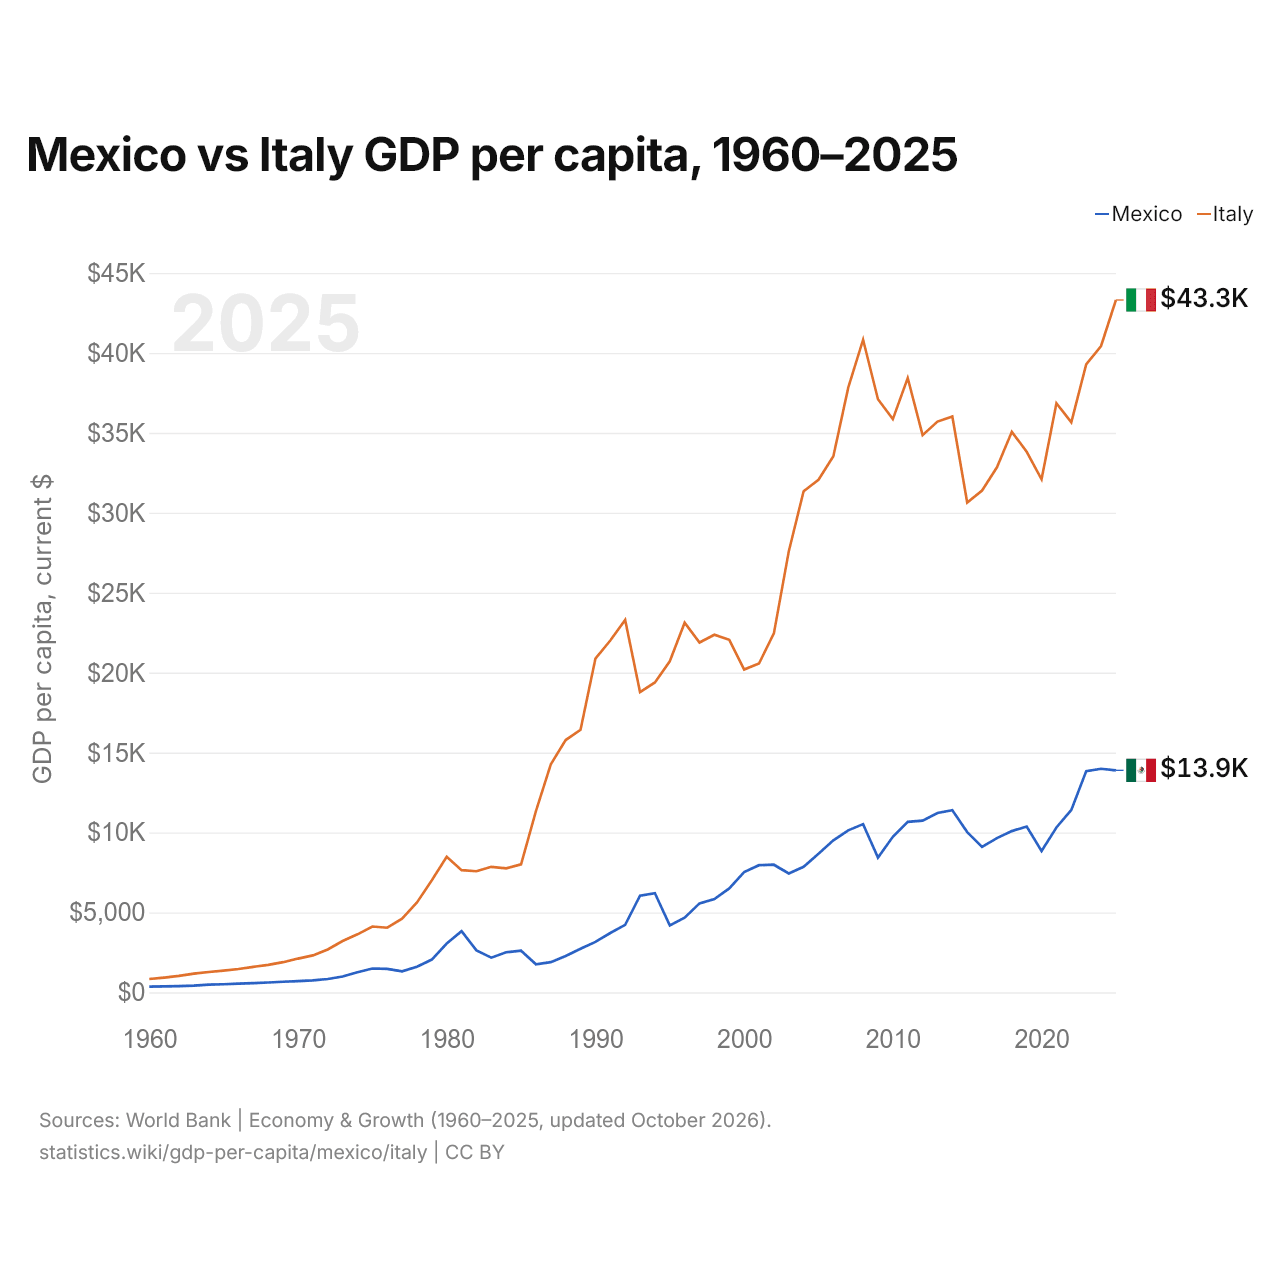
En 2025, le PIB par habitant était de 13 889 $ US au Mexique et de 43 309 $ US en Italie : 3,1 fois plus élevé en Italie. En 1960, il était de 355 $ US au Mexique et de 837 $ US en Italie, soit 2,4 fois plus en Italie.
Le PIB par habitant de l'Italie est plus élevé que celui du Mexique chaque année depuis 1960. À prix constants de 2015, le PIB par habitant du Mexique a été multiplié par 2,5 entre 1960 et 2025, et celui de l'Italie par 3,6.
Mexique vs Italie : derniers chiffres du PIB par habitant
|
Mexique
|
Italie
|
|
|---|---|---|
| PIB par habitant, dollars US courants | 13 889 $US | 43 309 $US |
| Rang mondial | 76/197 | 29/197 |
| PIB par habitant, dollars US constants de 2015 | 10 257 $US | 34 716 $US |
| × moyenne mondiale | 0,96× | 3,01× |
| Écart de PIB par habitant | 0,32× | 3,1× |
Comparer le PIB par habitant de 2 pays au choix
Sources :
- Banque mondiale | Économie et croissance (1960–2025, mis à jour en octobre 2026)
Creative Commons Attribution (CC BY) : vous pouvez copier, partager, adapter et réutiliser ce contenu, y compris à des fins commerciales, à condition de citer statistics.wiki et d’indiquer les modifications apportées. Les sources citées ci-dessus peuvent avoir leurs propres conditions de licence.