
Israël vs Irak : PIB par habitant, 1960–2025
| Année | PIB par habitant, dollars US courants | |
|---|---|---|
 Israël |
 Irak |
|
| 2025 | 60 337 $ US | 5 410 $ US |
| 2024 | 54 217 $ US | 6 074 $ US |
| 2023 | 52 126 $ US | 5 965 $ US |
| 2022 | 54 947 $ US | 6 521 $ US |
| 2021 | 52 258 $ US | 4 868 $ US |
| 2020 | 44 591 $ US | 4 295 $ US |
| 2019 | 44 092 $ US | 5 672 $ US |
| 2018 | 42 269 $ US | 5 647 $ US |
| 2017 | 41 013 $ US | 4 759 $ US |
| 2016 | 37 571 $ US | 4 334 $ US |
| 2015 | 36 138 $ US | 4 440 $ US |
| 2014 | 38 265 $ US | 6 249 $ US |
| 2013 | 36 981 $ US | 6 650 $ US |
| 2012 | 33 269 $ US | 6 478 $ US |
| 2011 | 34 477 $ US | 5 776 $ US |
| 2010 | 31 399 $ US | 4 462 $ US |
| 2009 | 28 470 $ US | 3 715 $ US |
| 2008 | 30 231 $ US | 4 543 $ US |
| 2007 | 25 689 $ US | 3 129 $ US |
| 2006 | 22 500 $ US | 2 277 $ US |
| 2005 | 21 262 $ US | 1 762 $ US |
| 2004 | 20 550 $ US | 1 328 $ US |
| 2003 | 19 624 $ US | 818 $ US |
| 2002 | 19 059 $ US | 1 266 $ US |
| 2001 | 20 949 $ US | 1 436 $ US |
| 2000 | 21 690 $ US | 1 980 $ US |
| 1999 | 19 809 $ US | 1 560 $ US |
| 1998 | 20 176 $ US | 901 $ US |
| 1997 | 20 457 $ US | 936 $ US |
| 1996 | 20 213 $ US | 485 $ US |
| 1995 | 19 014 $ US | 619 $ US |
| 1994 | 16 796 $ US | 198,2 $ US |
| 1993 | 15 169 $ US | 53,7 $ US |
| 1992 | 15 500 $ US | 30,3 $ US |
| 1991 | 14 337 $ US | 23 $ US |
| 1990 | 13 300 $ US | 10 261 $ US |
| 1989 | 11 601 $ US | 3 791 $ US |
| 1988 | 11 846 $ US | 3 707 $ US |
| 1987 | 9 847 $ US | 3 436 $ US |
| 1986 | 8 330 $ US | 2 940 $ US |
| 1985 | 6 824 $ US | 3 088 $ US |
| 1984 | 7 364 $ US | 3 066 $ US |
| 1983 | 7 955 $ US | 2 743 $ US |
| 1982 | 7 253 $ US | 2 942 $ US |
| 1981 | 6 791 $ US | 2 700 $ US |
| 1980 | 6 545 $ US | 3 868 $ US |
| 1979 | 5 968 $ US | 2 871 $ US |
| 1978 | 4 794 $ US | 1 863 $ US |
| 1977 | 5 050 $ US | 1 609 $ US |
| 1976 | 4 514 $ US | 1 489 $ US |
| 1975 | 4 669 $ US | 1 166 $ US |
| 1974 | 5 082 $ US | 1 031 $ US |
| 1973 | 3 629 $ US | 476 $ US |
| 1972 | 2 928 $ US | 394 $ US |
| 1971 | 2 297 $ US | 384 $ US |
| 1970 | 2 489 $ US | 337 $ US |
| 1969 | 2 188 $ US | 320 $ US |
| 1968 | 1 946 $ US | 319 $ US |
| 1967 | 1 734 $ US | 290,6 $ US |
| 1966 | 1 788 $ US | 298,2 $ US |
| 1965 | 1 688 $ US | 284,8 $ US |
| 1964 | 1 625 $ US | 269,4 $ US |
| 1963 | 1 485 $ US | 235,5 $ US |
| 1962 | 1 293 $ US | 240,7 $ US |
| 1961 | 1 696 $ US | 232,4 $ US |
| 1960 | 1 452 $ US | 218,9 $ US |
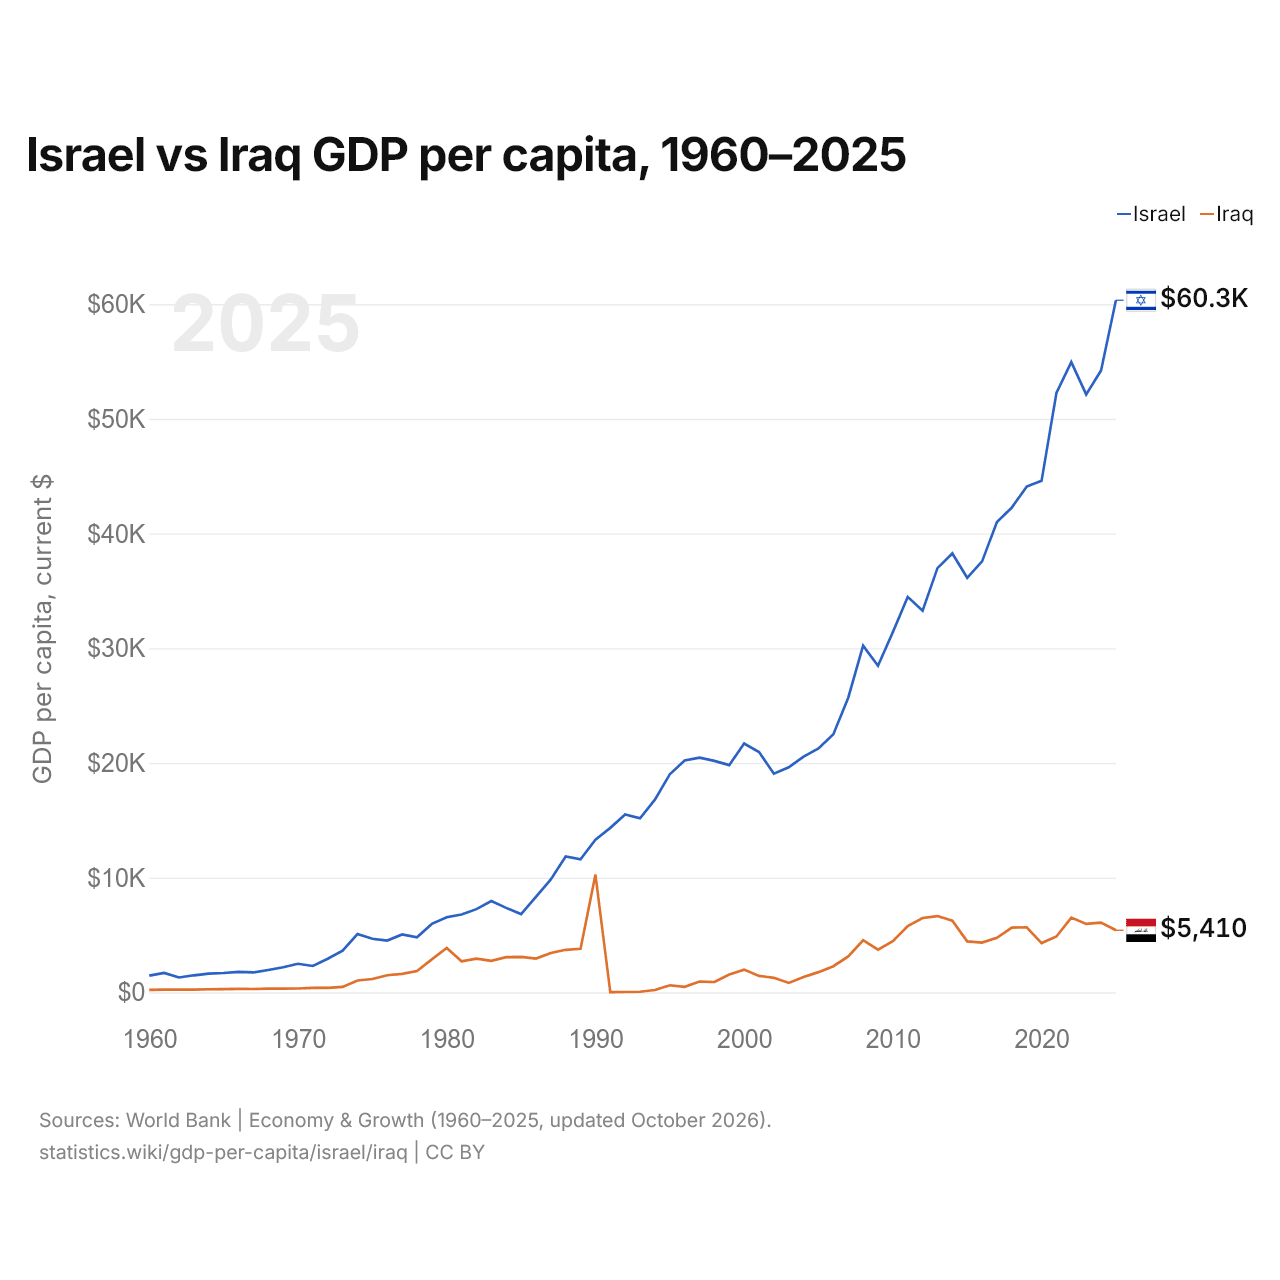
En 2025, le PIB par habitant était de 60 337 $ US en Israël et de 5 410 $ US en Irak : 11 fois plus élevé en Israël. En 1960, il était de 1 452 $ US en Israël et de 219 $ US en Irak, soit 6,6 fois plus en Israël.
Le PIB par habitant d'Israël est plus élevé que celui de l'Irak chaque année depuis 1960. À prix constants de 2015, le PIB par habitant d'Israël a été multiplié par 4,8 entre 1960 et 2025, et celui de l'Irak par 4.
Israël vs Irak : derniers chiffres du PIB par habitant
|
Israël
|
Irak
|
|
|---|---|---|
| PIB par habitant, dollars US courants | 60 337 $US | 5 410 $US |
| Rang mondial | 19/197 | 119/197 |
| PIB par habitant, dollars US constants de 2015 | 42 596 $US | 4 005 $US |
| × moyenne mondiale | 4,19× | 0,38× |
| Écart de PIB par habitant | 11× | 0,09× |
Comparer le PIB par habitant de 2 pays au choix
Sources :
- Banque mondiale | Économie et croissance (1960–2025, mis à jour en octobre 2026)
Creative Commons Attribution (CC BY) : vous pouvez copier, partager, adapter et réutiliser ce contenu, y compris à des fins commerciales, à condition de citer statistics.wiki et d’indiquer les modifications apportées. Les sources citées ci-dessus peuvent avoir leurs propres conditions de licence.