
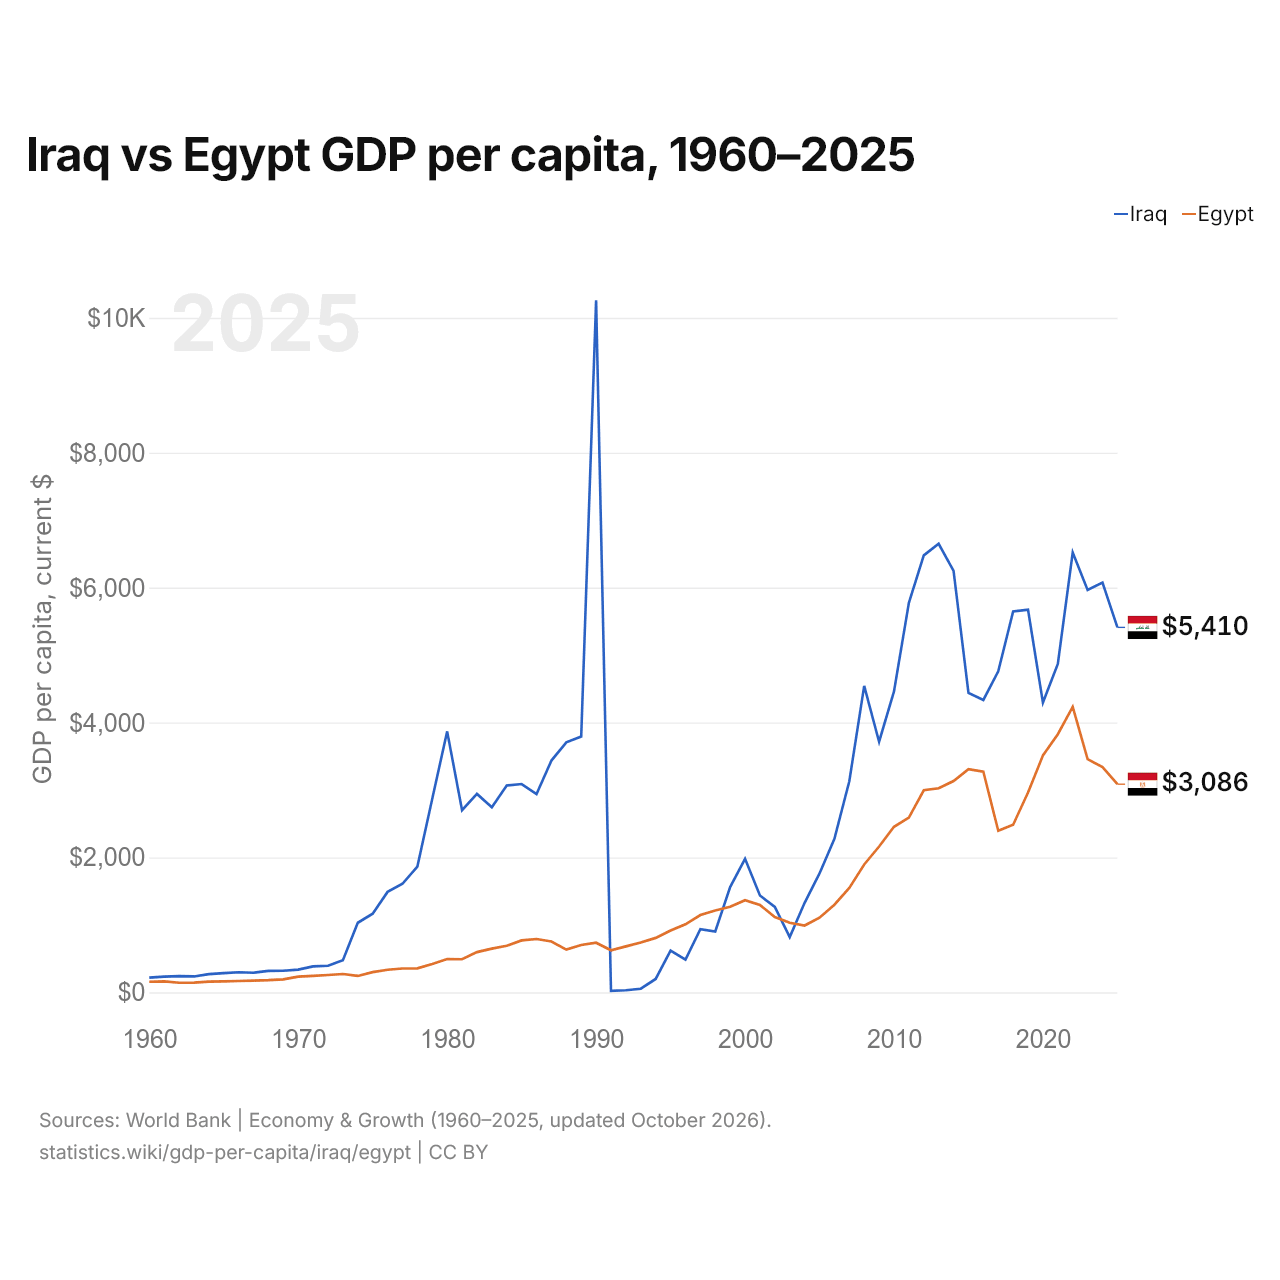
Irak vs Égypte : PIB par habitant, 1960–2025
| Année | PIB par habitant, dollars US courants | |
|---|---|---|
 Irak |
 Égypte |
|
| 2025 | 5 410 $ US | 3 086 $ US |
| 2024 | 6 074 $ US | 3 338 $ US |
| 2023 | 5 965 $ US | 3 457 $ US |
| 2022 | 6 521 $ US | 4 233 $ US |
| 2021 | 4 868 $ US | 3 827 $ US |
| 2020 | 4 295 $ US | 3 511 $ US |
| 2019 | 5 672 $ US | 2 963 $ US |
| 2018 | 5 647 $ US | 2 485 $ US |
| 2017 | 4 759 $ US | 2 395 $ US |
| 2016 | 4 334 $ US | 3 271 $ US |
| 2015 | 4 440 $ US | 3 307 $ US |
| 2014 | 6 249 $ US | 3 133 $ US |
| 2013 | 6 650 $ US | 3 026 $ US |
| 2012 | 6 478 $ US | 2 996 $ US |
| 2011 | 5 776 $ US | 2 591 $ US |
| 2010 | 4 462 $ US | 2 455 $ US |
| 2009 | 3 715 $ US | 2 162 $ US |
| 2008 | 4 543 $ US | 1 896 $ US |
| 2007 | 3 129 $ US | 1 548 $ US |
| 2006 | 2 277 $ US | 1 299 $ US |
| 2005 | 1 762 $ US | 1 106 $ US |
| 2004 | 1 328 $ US | 991 $ US |
| 2003 | 818 $ US | 1 031 $ US |
| 2002 | 1 266 $ US | 1 117 $ US |
| 2001 | 1 436 $ US | 1 295 $ US |
| 2000 | 1 980 $ US | 1 366 $ US |
| 1999 | 1 560 $ US | 1 268 $ US |
| 1998 | 901 $ US | 1 213 $ US |
| 1997 | 936 $ US | 1 146 $ US |
| 1996 | 485 $ US | 1 009 $ US |
| 1995 | 619 $ US | 916 $ US |
| 1994 | 198,2 $ US | 807 $ US |
| 1993 | 53,7 $ US | 740 $ US |
| 1992 | 30,3 $ US | 681 $ US |
| 1991 | 23 $ US | 623 $ US |
| 1990 | 10 261 $ US | 736 $ US |
| 1989 | 3 791 $ US | 701 $ US |
| 1988 | 3 707 $ US | 634 $ US |
| 1987 | 3 436 $ US | 754 $ US |
| 1986 | 2 940 $ US | 790 $ US |
| 1985 | 3 088 $ US | 770 $ US |
| 1984 | 3 066 $ US | 690 $ US |
| 1983 | 2 743 $ US | 648 $ US |
| 1982 | 2 942 $ US | 596 $ US |
| 1981 | 2 700 $ US | 490 $ US |
| 1980 | 3 868 $ US | 493 $ US |
| 1979 | 2 871 $ US | 421 $ US |
| 1978 | 1 863 $ US | 355 $ US |
| 1977 | 1 609 $ US | 353 $ US |
| 1976 | 1 489 $ US | 335 $ US |
| 1975 | 1 166 $ US | 299,2 $ US |
| 1974 | 1 031 $ US | 243,1 $ US |
| 1973 | 476 $ US | 272,2 $ US |
| 1972 | 394 $ US | 256,5 $ US |
| 1971 | 384 $ US | 243 $ US |
| 1970 | 337 $ US | 232,3 $ US |
| 1969 | 320 $ US | 193 $ US |
| 1968 | 319 $ US | 179,8 $ US |
| 1967 | 290,6 $ US | 174,1 $ US |
| 1966 | 298,2 $ US | 168,1 $ US |
| 1965 | 284,8 $ US | 161,6 $ US |
| 1964 | 269,4 $ US | 157,7 $ US |
| 1963 | 235,5 $ US | 143,9 $ US |
| 1962 | 240,7 $ US | 142,4 $ US |
| 1961 | 232,4 $ US | 162,8 $ US |
| 1960 | 218,9 $ US | 156,4 $ US |
En 2025, le PIB par habitant était de 5 410 $ US en Irak et de 3 086 $ US en Égypte : 1,8 fois plus élevé en Irak. En 1960, il était de 219 $ US en Irak et de 156 $ US en Égypte, soit 40 % de plus en Irak.
Le PIB par habitant de l'Irak est plus élevé que celui de l'Égypte chaque année depuis 2004. À prix constants de 2015, le PIB par habitant de l'Irak a été multiplié par 4 entre 1960 et 2025, et celui de l'Égypte par 5,6. En parité de pouvoir d'achat, l'ordre s'inverse : le PIB par habitant (PPA) est de 20 204 dollars en Égypte et de 14 267 dollars en Irak.
Irak vs Égypte : derniers chiffres du PIB par habitant
Comparer le PIB par habitant de 2 pays au choix
Sources :
- Banque mondiale | Économie et croissance (1960–2025, mis à jour en octobre 2026)
Creative Commons Attribution (CC BY) : vous pouvez copier, partager, adapter et réutiliser ce contenu, y compris à des fins commerciales, à condition de citer statistics.wiki et d’indiquer les modifications apportées. Les sources citées ci-dessus peuvent avoir leurs propres conditions de licence.