
Royaume-Uni vs Corée du Sud : réserves de change (or compris) par année, 1960–2025
| Année | $ US | |
|---|---|---|
 Royaume-Uni |
 Corée du Sud |
|
| 2025 | 214 355 349 052 $ US | 436 572 785 444 $ US |
| 2024 | 174 597 843 325 $ US | 418 218 648 902 $ US |
| 2023 | 177 915 356 242 $ US | 420 930 029 064 $ US |
| 2022 | 176 409 966 647 $ US | 423 365 991 593 $ US |
| 2021 | 194 181 397 315 $ US | 463 281 305 723 $ US |
| 2020 | 180 054 101 390 $ US | 443 462 937 570 $ US |
| 2019 | 173 569 199 263 $ US | 408 819 161 842 $ US |
| 2018 | 172 657 749 536 $ US | 403 082 233 386 $ US |
| 2017 | 150 857 673 779 $ US | 388 804 901 514 $ US |
| 2016 | 134 931 850 848 $ US | 370 154 204 333 $ US |
| 2015 | 148 109 299 506 $ US | 366 707 257 929 $ US |
| 2014 | 124 487 425 221 $ US | 362 834 692 845 $ US |
| 2013 | 118 750 193 780 $ US | 345 694 098 075 $ US |
| 2012 | 117 156 976 865 $ US | 327 724 415 843 $ US |
| 2011 | 109 733 899 591 $ US | 306 934 526 876 $ US |
| 2010 | 98 025 460 114 $ US | 292 143 494 467 $ US |
| 2009 | 79 453 490 100 $ US | 270 437 145 808 $ US |
| 2008 | 64 785 716 443 $ US | 201 544 913 439 $ US |
| 2007 | 77 715 465 907 $ US | 262 532 669 803 $ US |
| 2006 | 63 823 577 314 $ US | 239 148 089 521 $ US |
| 2005 | 59 135 108 205 $ US | 210 552 008 739 $ US |
| 2004 | 62 138 194 999 $ US | 199 195 487 365 $ US |
| 2003 | 56 349 681 040 $ US | 155 471 714 191 $ US |
| 2002 | 54 959 281 999 $ US | 121 497 596 258 $ US |
| 2001 | 47 417 467 709 $ US | 102 875 399 954 $ US |
| 2000 | 50 939 389 681 $ US | 96 250 965 793 $ US |
| 1999 | 46 188 288 222 $ US | 74 114 183 446 $ US |
| 1998 | 38 829 795 838 $ US | 52 099 586 441 $ US |
| 1997 | 37 662 299 516 $ US | 20 465 115 655 $ US |
| 1996 | 46 700 021 360 $ US | 34 157 940 704 $ US |
| 1995 | 49 144 184 298 $ US | 32 804 280 495 $ US |
| 1994 | 48 079 032 624 $ US | 25 763 879 675 $ US |
| 1993 | 43 982 206 194 $ US | 20 354 785 676 $ US |
| 1992 | 42 844 142 574 $ US | 17 228 143 548 $ US |
| 1991 | 48 572 195 809 $ US | 13 814 693 351 $ US |
| 1990 | 43 145 747 847 $ US | 14 916 134 693 $ US |
| 1989 | 42 381 854 894 $ US | 15 341 828 165 $ US |
| 1988 | 51 899 597 618 $ US | 12 477 906 377 $ US |
| 1987 | 50 917 928 958 $ US | 3 738 510 910 $ US |
| 1986 | 25 853 390 488 $ US | 3 443 374 519 $ US |
| 1985 | 19 081 735 747 $ US | 2 971 646 466 $ US |
| 1984 | 15 306 822 448 $ US | 2 848 932 436 $ US |
| 1983 | 18 593 267 596 $ US | 2 462 789 216 $ US |
| 1982 | 21 083 020 685 $ US | 2 945 853 719 $ US |
| 1981 | 22 802 299 491 $ US | 2 802 003 320 $ US |
| 1980 | 31 755 311 531 $ US | 3 100 858 988 $ US |
| 1979 | 29 084 847 009 $ US | 3 110 375 729 $ US |
| 1978 | 21 184 736 972 $ US | 2 826 038 818 $ US |
| 1977 | 23 778 086 731 $ US | 2 991 368 743 $ US |
| 1976 | 6 208 263 110 $ US | 1 985 105 840 $ US |
| 1975 | 7 547 578 527 $ US | 796 941 363 $ US |
| 1974 | 9 959 015 733 $ US | 297 744 267 $ US |
| 1973 | 7 946 929 576 $ US | 897 136 979 $ US |
| 1972 | 6 214 060 489 $ US | 529 914 853 $ US |
| 1971 | 8 956 892 354 $ US | 437 824 675 $ US |
| 1970 | 2 918 294 770 $ US | 609 950 462 $ US |
| 1969 | 2 535 411 000 $ US | 552 934 355 $ US |
| 1968 | 2 712 427 900 $ US | 391 778 858 $ US |
| 1967 | 2 702 371 600 $ US | 356 582 297 $ US |
| 1966 | 3 109 538 540 $ US | 245 208 677 $ US |
| 1965 | 3 011 764 240 $ US | 146 287 069 $ US |
| 1964 | 2 322 326 240 $ US | 136 361 056 $ US |
| 1963 | 3 153 679 121 $ US | 131 455 309 $ US |
| 1962 | 3 313 161 731 $ US | 168 650 270 $ US |
| 1961 | 3 327 714 600 $ US | 207 046 580 $ US |
| 1960 | 3 767 016 801 $ US | 157 015 600 $ US |
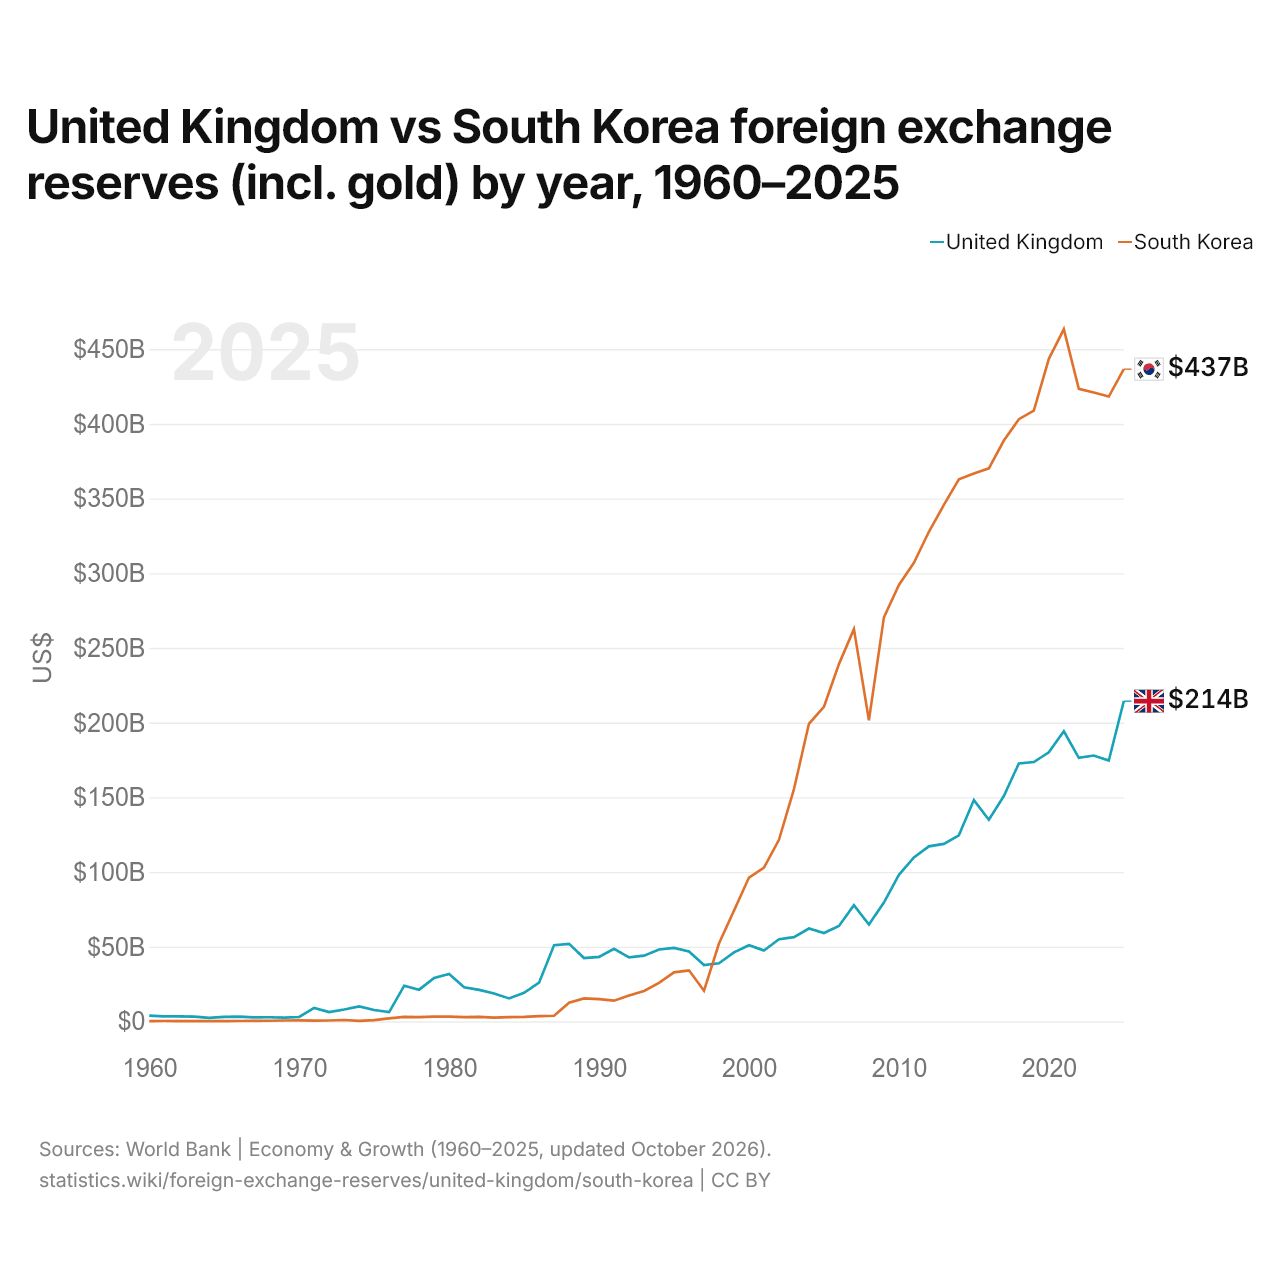
En 2025, les réserves de change du Royaume-Uni s'élevaient à 214 milliards de dollars et celles de la Corée du Sud à 437 milliards de dollars : celles de la Corée du Sud étaient 2,0 fois plus élevées. En 1960, les réserves du Royaume-Uni étaient 24 fois plus élevées : 3,77 milliards de dollars pour le Royaume-Uni et 157 millions de dollars pour la Corée du Sud.
Les réserves de change de la Corée du Sud sont supérieures à celles du Royaume-Uni chaque année depuis 1998.
Royaume-Uni vs Corée du Sud : réserves, or compris, et mois d'importations couverts
|
Royaume-Uni
|
Corée du Sud
|
|
|---|---|---|
| Réserves, or compris | 214 Md $US | 437 Md $US |
| Mois d'importations | 2,0 | 6,9 |
| Rang mondial | 19/168 | 9/168 |
| Écart des réserves | 0,49× | 2× |
Comparer les réserves de change de 2 pays au choix
Sources :
- Banque mondiale | Économie et croissance (1960–2025, mis à jour en octobre 2026)
Creative Commons Attribution (CC BY) : vous pouvez copier, partager, adapter et réutiliser ce contenu, y compris à des fins commerciales, à condition de citer statistics.wiki et d’indiquer les modifications apportées. Les sources citées ci-dessus peuvent avoir leurs propres conditions de licence.