
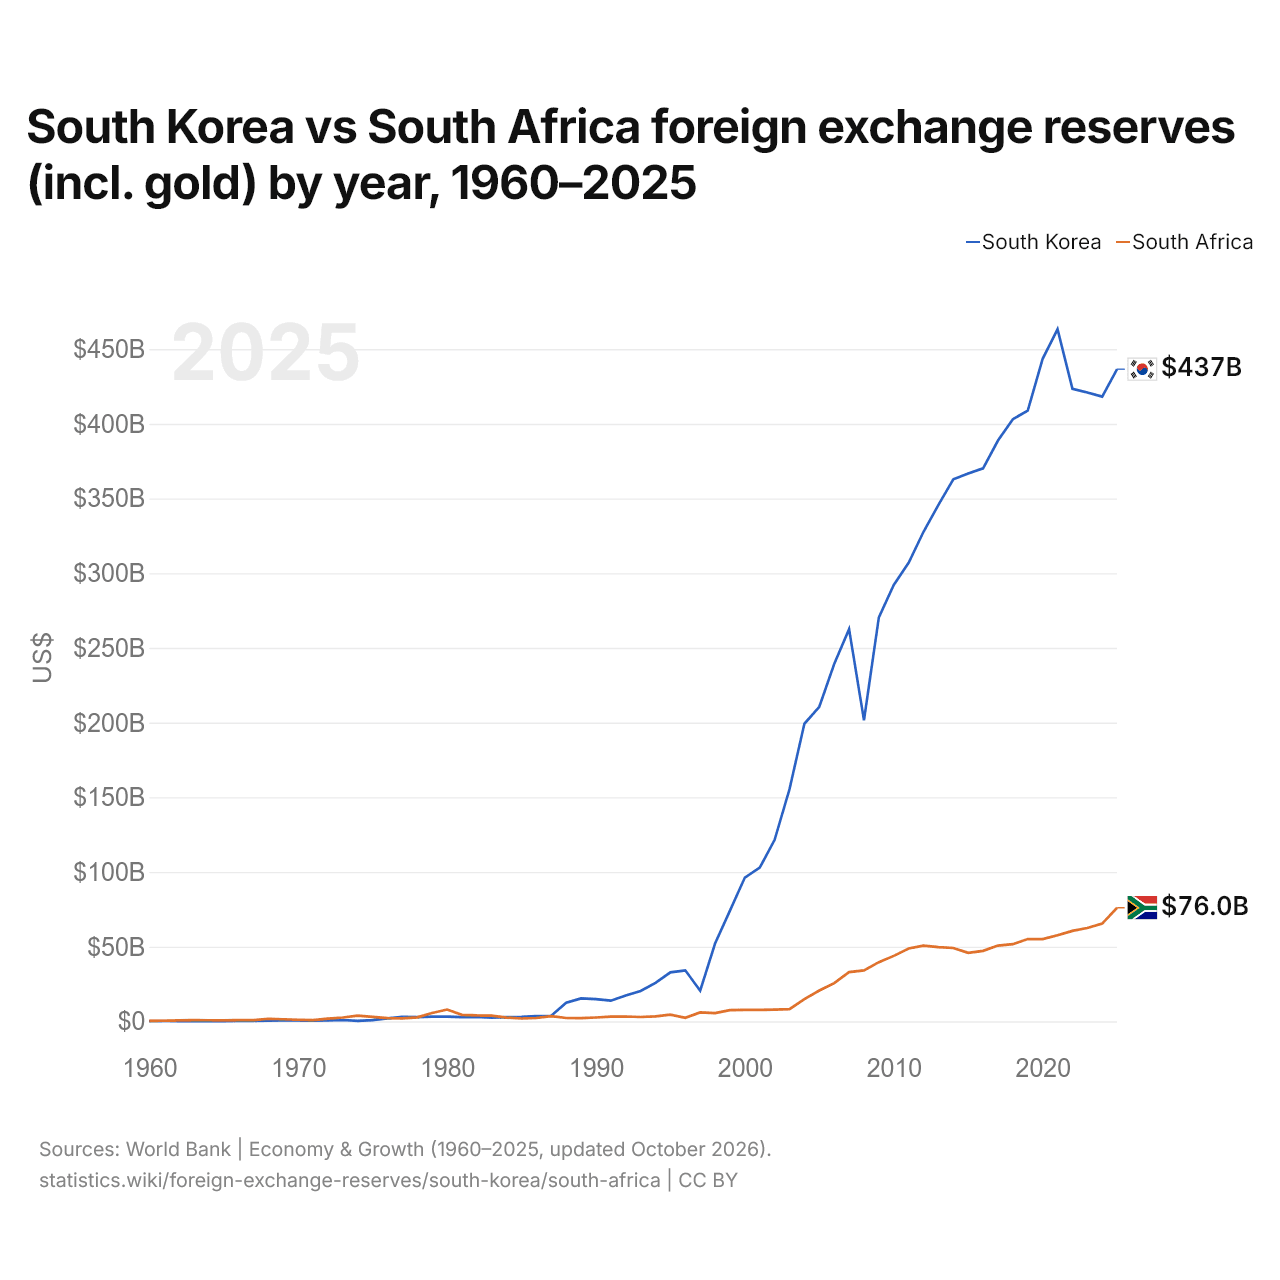
Corée du Sud vs Afrique du Sud : réserves de change (or compris) par année, 1960–2025
| Année | $ US | |
|---|---|---|
 Corée du Sud |
 Afrique du Sud |
|
| 2025 | 436 572 785 444 $ US | 76 023 398 334 $ US |
| 2024 | 418 218 648 902 $ US | 65 434 957 159 $ US |
| 2023 | 420 930 029 064 $ US | 62 491 675 820 $ US |
| 2022 | 423 365 991 593 $ US | 60 553 113 006 $ US |
| 2021 | 463 281 305 723 $ US | 57 597 149 617 $ US |
| 2020 | 443 462 937 570 $ US | 55 008 491 996 $ US |
| 2019 | 408 819 161 842 $ US | 55 055 893 657 $ US |
| 2018 | 403 082 233 386 $ US | 51 642 041 967 $ US |
| 2017 | 388 804 901 514 $ US | 50 722 891 363 $ US |
| 2016 | 370 154 204 333 $ US | 47 180 127 301 $ US |
| 2015 | 366 707 257 929 $ US | 45 887 065 757 $ US |
| 2014 | 362 834 692 845 $ US | 49 121 568 380 $ US |
| 2013 | 345 694 098 075 $ US | 49 708 174 894 $ US |
| 2012 | 327 724 415 843 $ US | 50 688 078 405 $ US |
| 2011 | 306 934 526 876 $ US | 48 748 260 246 $ US |
| 2010 | 292 143 494 467 $ US | 43 819 545 749 $ US |
| 2009 | 270 437 145 808 $ US | 39 602 644 576 $ US |
| 2008 | 201 544 913 439 $ US | 34 070 371 607 $ US |
| 2007 | 262 532 669 803 $ US | 32 919 403 651 $ US |
| 2006 | 239 148 089 521 $ US | 25 593 361 431 $ US |
| 2005 | 210 552 008 739 $ US | 20 624 460 695 $ US |
| 2004 | 199 195 487 365 $ US | 14 886 243 628 $ US |
| 2003 | 155 471 714 191 $ US | 8 154 089 033 $ US |
| 2002 | 121 497 596 258 $ US | 7 816 784 858 $ US |
| 2001 | 102 875 399 954 $ US | 7 626 856 919 $ US |
| 2000 | 96 250 965 793 $ US | 7 702 061 132 $ US |
| 1999 | 74 114 183 446 $ US | 7 496 680 480 $ US |
| 1998 | 52 099 586 441 $ US | 5 508 053 231 $ US |
| 1997 | 20 465 115 655 $ US | 5 957 312 964 $ US |
| 1996 | 34 157 940 704 $ US | 2 341 014 433 $ US |
| 1995 | 32 804 280 495 $ US | 4 463 556 727 $ US |
| 1994 | 25 763 879 675 $ US | 3 294 868 535 $ US |
| 1993 | 20 354 785 676 $ US | 2 879 214 919 $ US |
| 1992 | 17 228 143 548 $ US | 3 207 728 532 $ US |
| 1991 | 13 814 693 351 $ US | 3 186 551 430 $ US |
| 1990 | 14 916 134 693 $ US | 2 582 983 158 $ US |
| 1989 | 15 341 828 165 $ US | 2 194 854 121 $ US |
| 1988 | 12 477 906 377 $ US | 2 203 670 971 $ US |
| 1987 | 3 738 510 910 $ US | 3 462 962 833 $ US |
| 1986 | 3 443 374 519 $ US | 2 254 162 464 $ US |
| 1985 | 2 971 646 466 $ US | 1 897 240 193 $ US |
| 1984 | 2 848 932 436 $ US | 2 510 957 152 $ US |
| 1983 | 2 462 789 216 $ US | 3 794 711 938 $ US |
| 1982 | 2 945 853 719 $ US | 3 944 050 949 $ US |
| 1981 | 2 802 003 320 $ US | 4 358 999 341 $ US |
| 1980 | 3 100 858 988 $ US | 7 888 263 457 $ US |
| 1979 | 3 110 375 729 $ US | 5 569 820 236 $ US |
| 1978 | 2 826 038 818 $ US | 2 635 700 791 $ US |
| 1977 | 2 991 368 743 $ US | 2 019 343 736 $ US |
| 1976 | 1 985 105 840 $ US | 2 132 510 126 $ US |
| 1975 | 796 941 363 $ US | 2 978 267 497 $ US |
| 1974 | 297 744 267 $ US | 3 780 673 386 $ US |
| 1973 | 897 136 979 $ US | 2 580 499 567 $ US |
| 1972 | 529 914 853 $ US | 1 772 585 940 $ US |
| 1971 | 437 824 675 $ US | 777 286 709 $ US |
| 1970 | 609 950 462 $ US | 1 056 681 100 $ US |
| 1969 | 552 934 355 $ US | 1 404 632 000 $ US |
| 1968 | 391 778 858 $ US | 1 716 029 000 $ US |
| 1967 | 356 582 297 $ US | 781 748 000 $ US |
| 1966 | 245 208 677 $ US | 834 478 000 $ US |
| 1965 | 146 287 069 $ US | 600 866 800 $ US |
| 1964 | 136 361 056 $ US | 706 829 200 $ US |
| 1963 | 131 455 309 $ US | 774 940 000 $ US |
| 1962 | 168 650 270 $ US | 647 247 500 $ US |
| 1961 | 207 046 580 $ US | 394 839 500 $ US |
| 1960 | 157 015 600 $ US | 272 204 000 $ US |
En 2025, les réserves de change de la Corée du Sud s'élevaient à 437 milliards de dollars et celles de l'Afrique du Sud à 76 milliards de dollars : celles de la Corée du Sud étaient 5,7 fois plus élevées. En 1960, les réserves de l'Afrique du Sud étaient 1,7 fois plus élevées : 157 millions de dollars pour la Corée du Sud et 272 millions de dollars pour l'Afrique du Sud.
Les réserves de change de la Corée du Sud sont supérieures à celles de l'Afrique du Sud chaque année depuis 1984.
Corée du Sud vs Afrique du Sud : réserves, or compris, et mois d'importations couverts
|
Corée du Sud
|
Afrique du Sud
|
|
|---|---|---|
| Réserves, or compris | 437 Md $US | 76,0 Md $US |
| Mois d'importations | 6,9 | 7,2 |
| Rang mondial | 9/168 | 36/168 |
| Écart des réserves | 5,7× | 0,17× |
Comparer les réserves de change de 2 pays au choix
Sources :
- Banque mondiale | Économie et croissance (1960–2025, mis à jour en octobre 2026)
Creative Commons Attribution (CC BY) : vous pouvez copier, partager, adapter et réutiliser ce contenu, y compris à des fins commerciales, à condition de citer statistics.wiki et d’indiquer les modifications apportées. Les sources citées ci-dessus peuvent avoir leurs propres conditions de licence.