
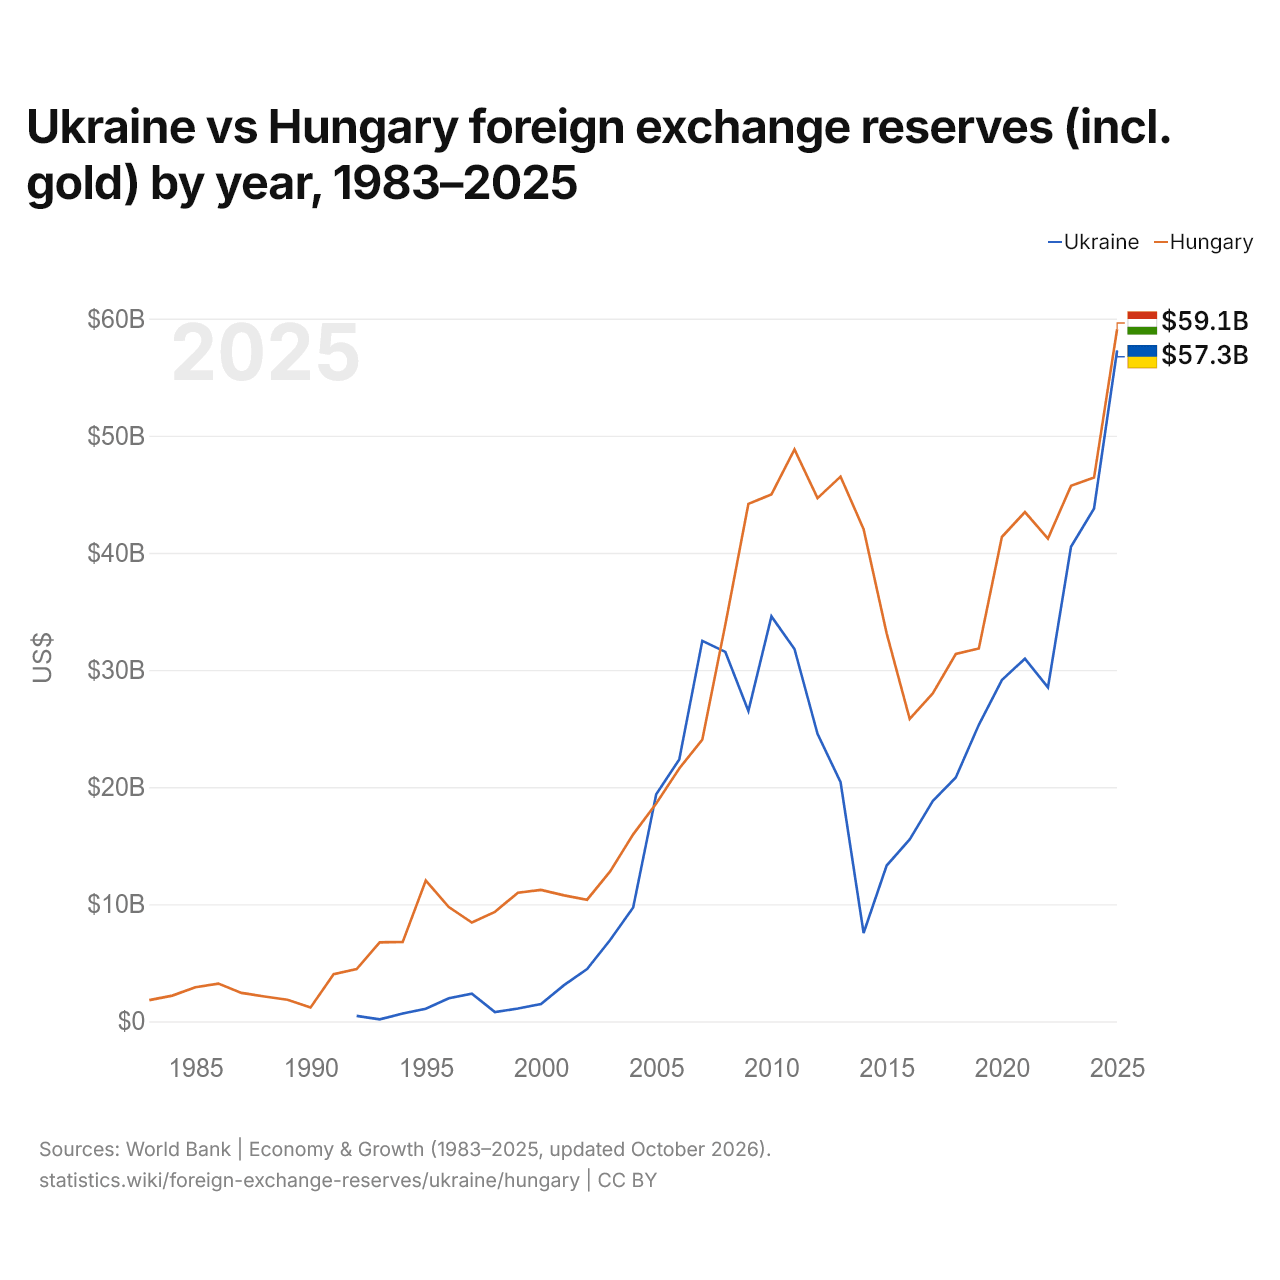
Ukraine vs Hongrie : réserves de change (or compris) par année, 1983–2025
| Année | $ US | |
|---|---|---|
 Ukraine |
 Hongrie |
|
| 2025 | 57 268 434 039 $ US | 59 094 575 607 $ US |
| 2024 | 43 780 549 773 $ US | 46 422 357 554 $ US |
| 2023 | 40 510 106 308 $ US | 45 718 623 573 $ US |
| 2022 | 28 505 931 892 $ US | 41 218 685 384 $ US |
| 2021 | 30 966 674 654 $ US | 43 483 375 179 $ US |
| 2020 | 29 137 541 200 $ US | 41 349 416 013 $ US |
| 2019 | 25 317 002 927 $ US | 31 831 003 375 $ US |
| 2018 | 20 817 897 004 $ US | 31 366 581 856 $ US |
| 2017 | 18 810 931 197 $ US | 28 002 680 652 $ US |
| 2016 | 15 537 256 304 $ US | 25 824 253 667 $ US |
| 2015 | 13 300 880 765 $ US | 33 124 288 326 $ US |
| 2014 | 7 538 804 512 $ US | 42 019 881 301 $ US |
| 2013 | 20 413 621 999 $ US | 46 508 013 998 $ US |
| 2012 | 24 552 796 497 $ US | 44 670 620 404 $ US |
| 2011 | 31 788 750 907 $ US | 48 831 918 089 $ US |
| 2010 | 34 571 298 928 $ US | 44 988 182 851 $ US |
| 2009 | 26 500 887 342 $ US | 44 181 292 717 $ US |
| 2008 | 31 543 343 237 $ US | 33 873 898 858 $ US |
| 2007 | 32 483 841 813 $ US | 24 052 210 871 $ US |
| 2006 | 22 359 564 313 $ US | 21 589 904 537 $ US |
| 2005 | 19 388 177 691 $ US | 18 602 833 678 $ US |
| 2004 | 9 718 436 096 $ US | 15 965 389 148 $ US |
| 2003 | 6 946 076 994 $ US | 12 793 544 669 $ US |
| 2002 | 4 462 353 859 $ US | 10 383 091 415 $ US |
| 2001 | 3 088 921 703 $ US | 10 755 092 581 $ US |
| 2000 | 1 477 202 336 $ US | 11 217 315 166 $ US |
| 1999 | 1 093 527 812 $ US | 10 983 333 392 $ US |
| 1998 | 792 954 527 $ US | 9 347 792 439 $ US |
| 1997 | 2 358 910 867 $ US | 8 437 175 640 $ US |
| 1996 | 1 971 655 947 $ US | 9 757 457 991 $ US |
| 1995 | 1 068 754 172 $ US | 12 017 181 273 $ US |
| 1994 | 664 538 695 $ US | 6 777 626 140 $ US |
| 1993 | 166 106 210 $ US | 6 744 523 276 $ US |
| 1992 | 468 913 725 $ US | 4 458 714 299 $ US |
| 1991 | - | 4 025 559 101 $ US |
| 1990 | - | 1 184 510 087 $ US |
| 1989 | - | 1 846 298 314 $ US |
| 1988 | - | 2 120 757 018 $ US |
| 1987 | - | 2 428 677 646 $ US |
| 1986 | - | 3 219 088 096 $ US |
| 1985 | - | 2 914 082 779 $ US |
| 1984 | - | 2 196 042 504 $ US |
| 1983 | - | 1 815 690 372 $ US |
En 2025, les réserves de change de l'Ukraine s'élevaient à 57,3 milliards de dollars et celles de la Hongrie à 59,1 milliards de dollars : celles de la Hongrie étaient supérieures de 3,2 %. En 1992, les réserves de la Hongrie étaient 9,5 fois plus élevées : 469 millions de dollars pour l'Ukraine et 4,46 milliards de dollars pour la Hongrie.
Les réserves de change de la Hongrie sont supérieures à celles de l'Ukraine chaque année depuis 2008.
Ukraine vs Hongrie : réserves, or compris, et mois d'importations couverts
|
Ukraine
|
Hongrie
|
|
|---|---|---|
| Réserves, or compris | 57,3 Md $US | 59,1 Md $US |
| Mois d'importations | 6,2 | 4,2 |
| Rang mondial | 44/168 | 43/168 |
| Écart des réserves | 0,97× | 1× |
Comparer les réserves de change de 2 pays au choix
Sources :
- Banque mondiale | Économie et croissance (1983–2025, mis à jour en octobre 2026)
Creative Commons Attribution (CC BY) : vous pouvez copier, partager, adapter et réutiliser ce contenu, y compris à des fins commerciales, à condition de citer statistics.wiki et d’indiquer les modifications apportées. Les sources citées ci-dessus peuvent avoir leurs propres conditions de licence.