
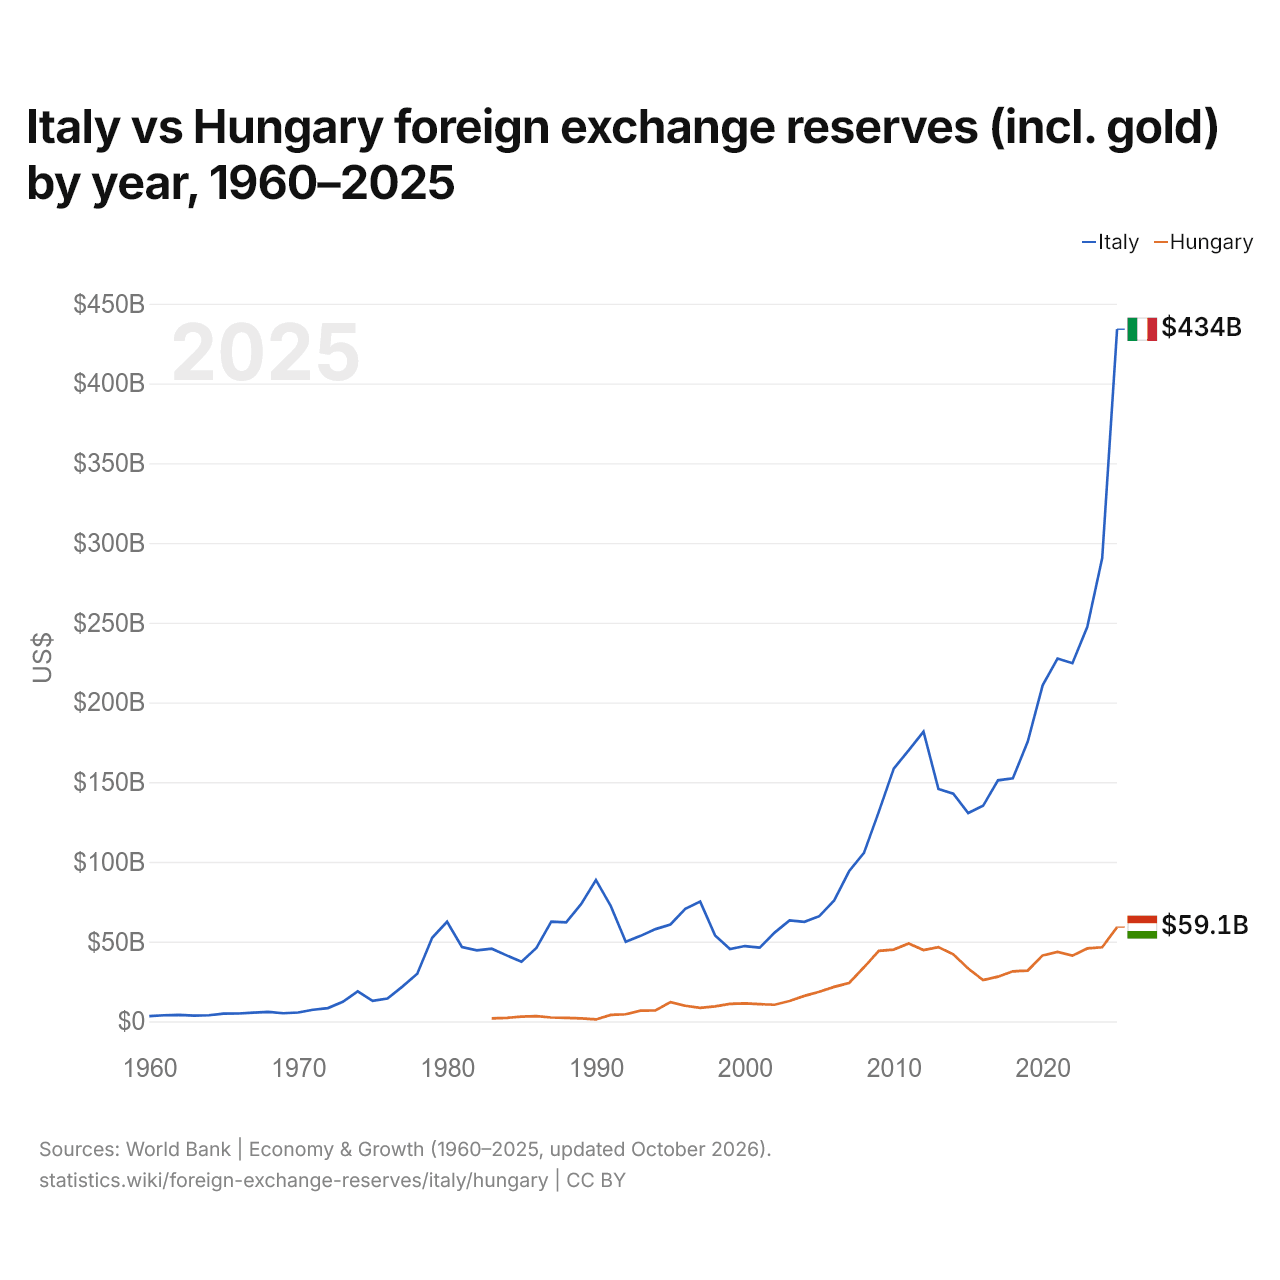
Italie vs Hongrie : réserves de change (or compris) par année, 1960–2025
| Année | $ US | |
|---|---|---|
 Italie |
 Hongrie |
|
| 2025 | 434 014 519 755 $ US | 59 094 575 607 $ US |
| 2024 | 290 547 420 426 $ US | 46 422 357 554 $ US |
| 2023 | 247 396 414 254 $ US | 45 718 623 573 $ US |
| 2022 | 224 580 577 612 $ US | 41 218 685 384 $ US |
| 2021 | 227 478 327 159 $ US | 43 483 375 179 $ US |
| 2020 | 210 687 330 553 $ US | 41 349 416 013 $ US |
| 2019 | 175 397 954 131 $ US | 31 831 003 375 $ US |
| 2018 | 152 361 936 422 $ US | 31 366 581 856 $ US |
| 2017 | 151 120 440 050 $ US | 28 002 680 652 $ US |
| 2016 | 135 133 283 787 $ US | 25 824 253 667 $ US |
| 2015 | 130 592 432 980 $ US | 33 124 288 326 $ US |
| 2014 | 142 756 493 255 $ US | 42 019 881 301 $ US |
| 2013 | 145 724 509 189 $ US | 46 508 013 998 $ US |
| 2012 | 181 670 318 701 $ US | 44 670 620 404 $ US |
| 2011 | 169 872 360 985 $ US | 48 831 918 089 $ US |
| 2010 | 158 478 306 213 $ US | 44 988 182 851 $ US |
| 2009 | 131 496 916 616 $ US | 44 181 292 717 $ US |
| 2008 | 105 649 105 828 $ US | 33 873 898 858 $ US |
| 2007 | 94 108 647 219 $ US | 24 052 210 871 $ US |
| 2006 | 75 773 325 816 $ US | 21 589 904 537 $ US |
| 2005 | 65 954 006 492 $ US | 18 602 833 678 $ US |
| 2004 | 62 386 140 318 $ US | 15 965 389 148 $ US |
| 2003 | 63 263 645 221 $ US | 12 793 544 669 $ US |
| 2002 | 55 621 728 399 $ US | 10 383 091 415 $ US |
| 2001 | 46 215 583 156 $ US | 10 755 092 581 $ US |
| 2000 | 47 201 146 788 $ US | 11 217 315 166 $ US |
| 1999 | 45 301 890 068 $ US | 10 983 333 392 $ US |
| 1998 | 53 879 698 134 $ US | 9 347 792 439 $ US |
| 1997 | 75 086 486 575 $ US | 8 437 175 640 $ US |
| 1996 | 70 566 438 038 $ US | 9 757 457 991 $ US |
| 1995 | 60 690 107 044 $ US | 12 017 181 273 $ US |
| 1994 | 57 817 130 022 $ US | 6 777 626 140 $ US |
| 1993 | 53 589 806 324 $ US | 6 744 523 276 $ US |
| 1992 | 49 861 589 541 $ US | 4 458 714 299 $ US |
| 1991 | 72 254 305 372 $ US | 4 025 559 101 $ US |
| 1990 | 88 595 441 116 $ US | 1 184 510 087 $ US |
| 1989 | 73 454 774 682 $ US | 1 846 298 314 $ US |
| 1988 | 62 067 048 706 $ US | 2 120 757 018 $ US |
| 1987 | 62 488 960 743 $ US | 2 428 677 646 $ US |
| 1986 | 46 048 953 034 $ US | 3 219 088 096 $ US |
| 1985 | 37 396 565 946 $ US | 2 914 082 779 $ US |
| 1984 | 41 349 282 776 $ US | 2 196 042 504 $ US |
| 1983 | 45 540 036 598 $ US | 1 815 690 372 $ US |
| 1982 | 44 552 893 204 $ US | - |
| 1981 | 46 635 435 135 $ US | - |
| 1980 | 62 427 835 828 $ US | - |
| 1979 | 52 353 996 729 $ US | - |
| 1978 | 29 895 032 078 $ US | - |
| 1977 | 21 780 300 210 $ US | - |
| 1976 | 14 337 537 091 $ US | - |
| 1975 | 12 874 206 632 $ US | - |
| 1974 | 18 789 255 457 $ US | - |
| 1973 | 12 211 762 050 $ US | - |
| 1972 | 8 300 403 742 $ US | - |
| 1971 | 7 283 733 925 $ US | - |
| 1970 | 5 547 425 490 $ US | - |
| 1969 | 5 061 676 400 $ US | - |
| 1968 | 5 918 045 600 $ US | - |
| 1967 | 5 476 253 200 $ US | - |
| 1966 | 4 923 709 110 $ US | - |
| 1965 | 4 808 141 120 $ US | - |
| 1964 | 3 831 167 440 $ US | - |
| 1963 | 3 624 125 520 $ US | - |
| 1962 | 4 072 606 720 $ US | - |
| 1961 | 3 809 235 500 $ US | - |
| 1960 | 3 288 591 200 $ US | - |
En 2025, les réserves de change de l'Italie s'élevaient à 434 milliards de dollars et celles de la Hongrie à 59,1 milliards de dollars : celles de l'Italie étaient 7,3 fois plus élevées. En 1983, les réserves de l'Italie étaient 25 fois plus élevées : 45,5 milliards de dollars pour l'Italie et 1,82 milliard de dollars pour la Hongrie.
Les réserves de change de l'Italie sont supérieures à celles de la Hongrie chaque année depuis 1983.
Italie vs Hongrie : réserves, or compris, et mois d'importations couverts
|
Italie
|
Hongrie
|
|
|---|---|---|
| Réserves, or compris | 434 Md $US | 59,1 Md $US |
| Mois d'importations | 6,7 | 4,2 |
| Rang mondial | 10/168 | 43/168 |
| Écart des réserves | 7,3× | 0,14× |
Comparer les réserves de change de 2 pays au choix
Sources :
- Banque mondiale | Économie et croissance (1960–2025, mis à jour en octobre 2026)
Creative Commons Attribution (CC BY) : vous pouvez copier, partager, adapter et réutiliser ce contenu, y compris à des fins commerciales, à condition de citer statistics.wiki et d’indiquer les modifications apportées. Les sources citées ci-dessus peuvent avoir leurs propres conditions de licence.