
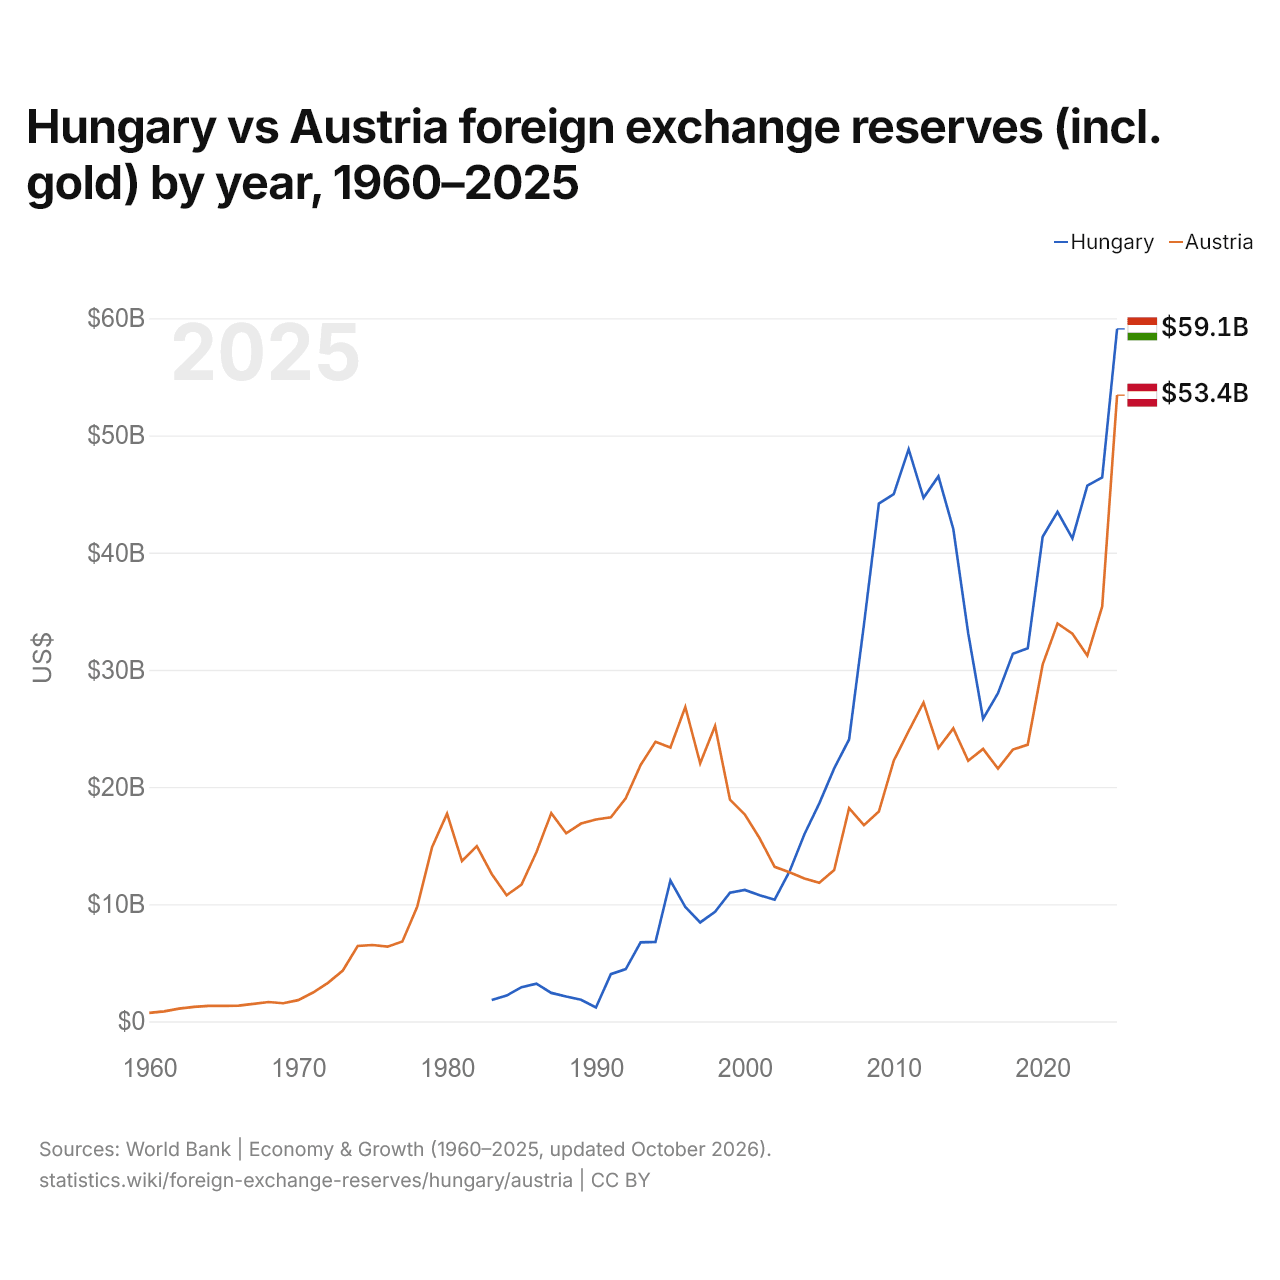
Hongrie vs Autriche : réserves de change (or compris) par année, 1960–2025
| Année | $ US | |
|---|---|---|
 Hongrie |
 Autriche |
|
| 2025 | 59 094 575 607 $ US | 53 437 030 354 $ US |
| 2024 | 46 422 357 554 $ US | 35 405 523 062 $ US |
| 2023 | 45 718 623 573 $ US | 31 212 416 322 $ US |
| 2022 | 41 218 685 384 $ US | 33 077 693 776 $ US |
| 2021 | 43 483 375 179 $ US | 33 957 000 221 $ US |
| 2020 | 41 349 416 013 $ US | 30 439 562 425 $ US |
| 2019 | 31 831 003 375 $ US | 23 616 397 438 $ US |
| 2018 | 31 366 581 856 $ US | 23 190 665 221 $ US |
| 2017 | 28 002 680 652 $ US | 21 565 331 649 $ US |
| 2016 | 25 824 253 667 $ US | 23 255 493 381 $ US |
| 2015 | 33 124 288 326 $ US | 22 239 731 668 $ US |
| 2014 | 42 019 881 301 $ US | 25 001 493 235 $ US |
| 2013 | 46 508 013 998 $ US | 23 316 756 962 $ US |
| 2012 | 44 670 620 404 $ US | 27 211 429 628 $ US |
| 2011 | 48 831 918 089 $ US | 24 768 999 165 $ US |
| 2010 | 44 988 182 851 $ US | 22 241 623 425 $ US |
| 2009 | 44 181 292 717 $ US | 17 903 949 015 $ US |
| 2008 | 33 873 898 858 $ US | 16 741 449 885 $ US |
| 2007 | 24 052 210 871 $ US | 18 193 955 715 $ US |
| 2006 | 21 589 904 537 $ US | 12 911 210 328 $ US |
| 2005 | 18 602 833 678 $ US | 11 827 977 058 $ US |
| 2004 | 15 965 389 148 $ US | 12 188 419 360 $ US |
| 2003 | 12 793 544 669 $ US | 12 729 301 827 $ US |
| 2002 | 10 383 091 415 $ US | 13 182 007 409 $ US |
| 2001 | 10 755 092 581 $ US | 15 598 207 439 $ US |
| 2000 | 11 217 315 166 $ US | 17 649 557 522 $ US |
| 1999 | 10 983 333 392 $ US | 18 923 059 531 $ US |
| 1998 | 9 347 792 439 $ US | 25 207 674 037 $ US |
| 1997 | 8 437 175 640 $ US | 22 021 086 580 $ US |
| 1996 | 9 757 457 991 $ US | 26 833 509 076 $ US |
| 1995 | 12 017 181 273 $ US | 23 368 742 795 $ US |
| 1994 | 6 777 626 140 $ US | 23 852 061 060 $ US |
| 1993 | 6 744 523 276 $ US | 21 878 103 248 $ US |
| 1992 | 4 458 714 299 $ US | 19 025 543 787 $ US |
| 1991 | 4 025 559 101 $ US | 17 414 573 770 $ US |
| 1990 | 1 184 510 087 $ US | 17 227 717 542 $ US |
| 1989 | 1 846 298 314 $ US | 16 881 871 851 $ US |
| 1988 | 2 120 757 018 $ US | 16 043 317 040 $ US |
| 1987 | 2 428 677 646 $ US | 17 768 883 013 $ US |
| 1986 | 3 219 088 096 $ US | 14 426 653 335 $ US |
| 1985 | 2 914 082 779 $ US | 11 678 513 740 $ US |
| 1984 | 2 196 042 504 $ US | 10 759 891 541 $ US |
| 1983 | 1 815 690 372 $ US | 12 575 296 677 $ US |
| 1982 | - | 14 949 075 030 $ US |
| 1981 | - | 13 676 529 640 $ US |
| 1980 | - | 17 725 433 544 $ US |
| 1979 | - | 14 883 522 738 $ US |
| 1978 | - | 9 804 525 357 $ US |
| 1977 | - | 6 813 640 726 $ US |
| 1976 | - | 6 374 077 148 $ US |
| 1975 | - | 6 510 895 769 $ US |
| 1974 | - | 6 428 287 967 $ US |
| 1973 | - | 4 335 902 626 $ US |
| 1972 | - | 3 280 220 049 $ US |
| 1971 | - | 2 455 021 252 $ US |
| 1970 | - | 1 805 764 300 $ US |
| 1969 | - | 1 541 024 000 $ US |
| 1968 | - | 1 650 819 000 $ US |
| 1967 | - | 1 488 335 600 $ US |
| 1966 | - | 1 336 543 420 $ US |
| 1965 | - | 1 314 046 080 $ US |
| 1964 | - | 1 319 442 160 $ US |
| 1963 | - | 1 229 910 840 $ US |
| 1962 | - | 1 081 957 340 $ US |
| 1961 | - | 847 058 100 $ US |
| 1960 | - | 720 945 600 $ US |
En 2025, les réserves de change de la Hongrie s'élevaient à 59,1 milliards de dollars et celles de l'Autriche à 53,4 milliards de dollars : celles de la Hongrie étaient supérieures de 11 %. En 1983, les réserves de l'Autriche étaient 6,9 fois plus élevées : 1,82 milliard de dollars pour la Hongrie et 12,6 milliards de dollars pour l'Autriche.
Les réserves de change de la Hongrie sont supérieures à celles de l'Autriche chaque année depuis 2003.
Hongrie vs Autriche : réserves, or compris, et mois d'importations couverts
|
Hongrie
|
Autriche
|
|
|---|---|---|
| Réserves, or compris | 59,1 Md $US | 53,4 Md $US |
| Mois d'importations | 4,2 | 2,1 |
| Rang mondial | 43/168 | 47/168 |
| Écart des réserves | 1,1× | 0,9× |
Comparer les réserves de change de 2 pays au choix
Sources :
- Banque mondiale | Économie et croissance (1960–2025, mis à jour en octobre 2026)
Creative Commons Attribution (CC BY) : vous pouvez copier, partager, adapter et réutiliser ce contenu, y compris à des fins commerciales, à condition de citer statistics.wiki et d’indiquer les modifications apportées. Les sources citées ci-dessus peuvent avoir leurs propres conditions de licence.