
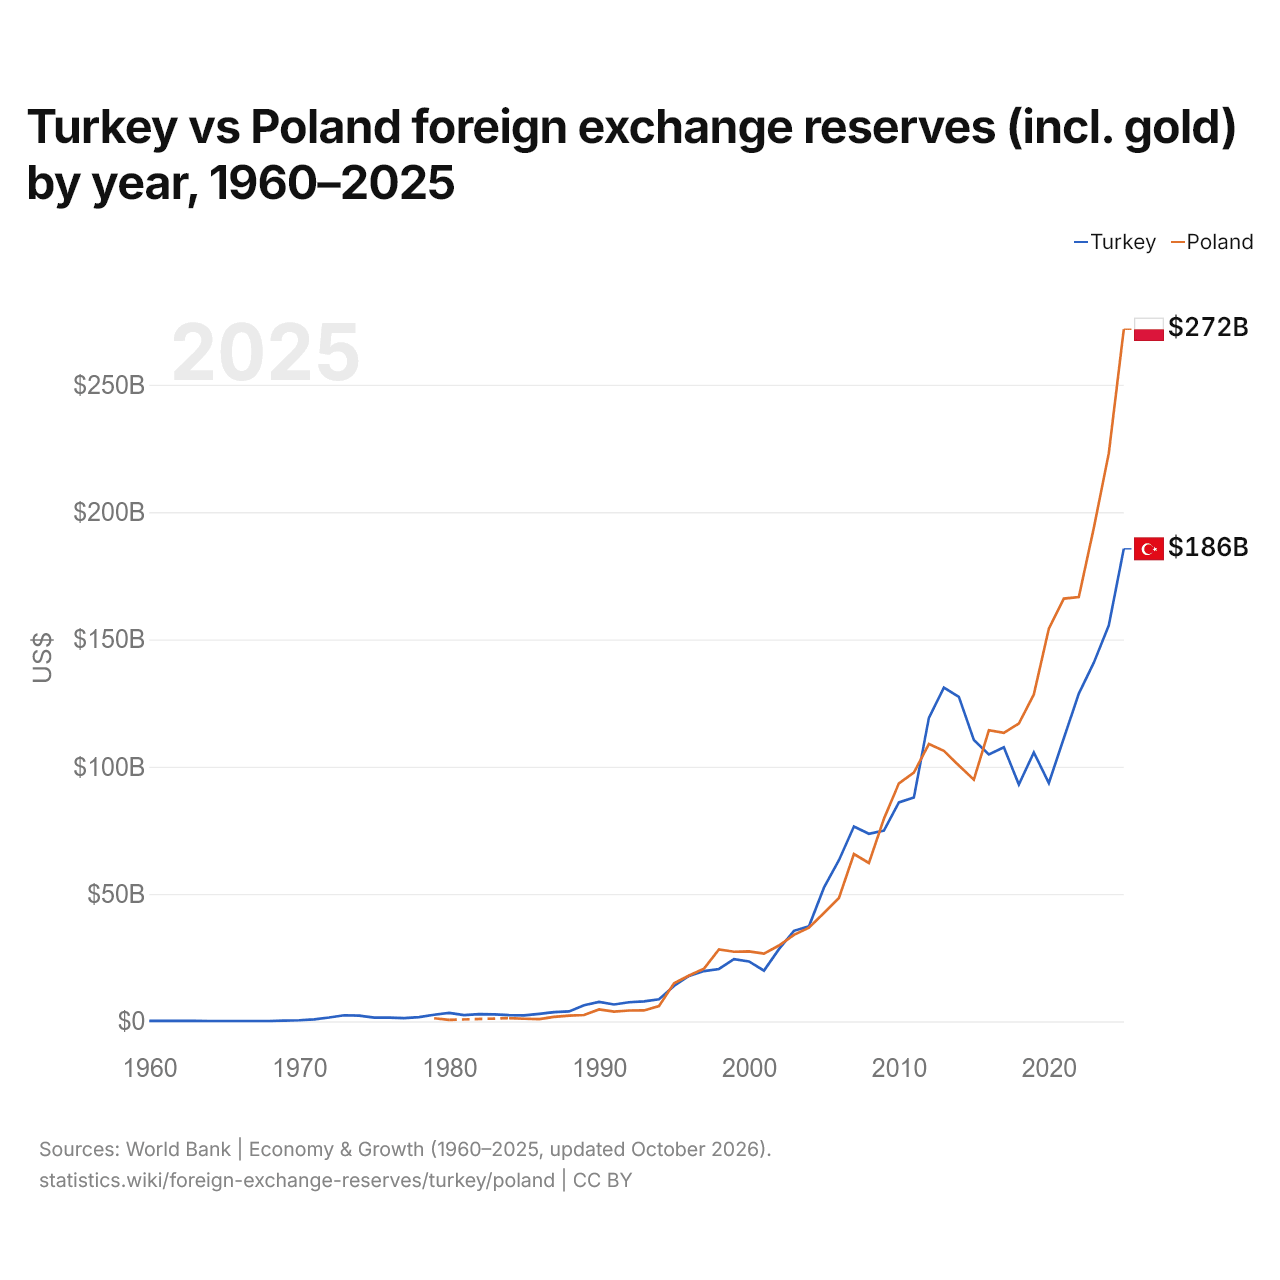
Turquie vs Pologne : réserves de change (or compris) par année, 1960–2025
| Année | $ US | |
|---|---|---|
 Turquie |
 Pologne |
|
| 2025 | 185 567 690 700 $ US | 271 805 173 253 $ US |
| 2024 | 155 548 682 878 $ US | 223 114 909 804 $ US |
| 2023 | 140 868 480 002 $ US | 193 783 277 723 $ US |
| 2022 | 128 735 003 396 $ US | 166 663 927 036 $ US |
| 2021 | 111 184 882 382 $ US | 166 030 186 476 $ US |
| 2020 | 93 584 577 917 $ US | 154 219 192 491 $ US |
| 2019 | 105 619 672 448 $ US | 128 392 157 887 $ US |
| 2018 | 92 997 230 041 $ US | 116 956 636 328 $ US |
| 2017 | 107 657 025 385 $ US | 113 267 368 075 $ US |
| 2016 | 104 810 530 764 $ US | 114 328 539 233 $ US |
| 2015 | 110 489 628 113 $ US | 94 902 630 299 $ US |
| 2014 | 127 421 921 236 $ US | 100 452 420 334 $ US |
| 2013 | 131 053 847 401 $ US | 106 221 491 036 $ US |
| 2012 | 119 182 965 975 $ US | 108 902 203 544 $ US |
| 2011 | 87 937 253 858 $ US | 97 712 435 349 $ US |
| 2010 | 85 959 461 666 $ US | 93 472 504 101 $ US |
| 2009 | 74 933 099 954 $ US | 79 521 599 626 $ US |
| 2008 | 73 674 684 816 $ US | 62 183 606 684 $ US |
| 2007 | 76 496 127 491 $ US | 65 724 834 525 $ US |
| 2006 | 63 264 841 174 $ US | 48 473 948 179 $ US |
| 2005 | 52 493 941 950 $ US | 42 560 656 301 $ US |
| 2004 | 37 304 121 309 $ US | 36 772 763 413 $ US |
| 2003 | 35 548 509 276 $ US | 33 958 963 963 $ US |
| 2002 | 28 348 030 217 $ US | 29 783 862 625 $ US |
| 2001 | 19 911 331 847 $ US | 26 563 086 840 $ US |
| 2000 | 23 514 529 510 $ US | 27 469 379 417 $ US |
| 1999 | 24 432 663 964 $ US | 27 314 254 943 $ US |
| 1998 | 20 567 605 389 $ US | 28 276 350 178 $ US |
| 1997 | 19 746 043 484 $ US | 20 669 498 321 $ US |
| 1996 | 17 819 437 052 $ US | 18 018 685 658 $ US |
| 1995 | 13 890 900 402 $ US | 14 957 023 987 $ US |
| 1994 | 8 633 212 506 $ US | 6 023 061 698 $ US |
| 1993 | 7 846 358 557 $ US | 4 276 726 019 $ US |
| 1992 | 7 507 926 869 $ US | 4 256 740 152 $ US |
| 1991 | 6 616 201 216 $ US | 3 799 891 432 $ US |
| 1990 | 7 626 099 814 $ US | 4 673 859 368 $ US |
| 1989 | 6 298 197 326 $ US | 2 503 603 416 $ US |
| 1988 | 3 912 434 398 $ US | 2 248 959 113 $ US |
| 1987 | 3 630 665 151 $ US | 1 723 208 693 $ US |
| 1986 | 2 912 507 103 $ US | 882 302 656 $ US |
| 1985 | 2 317 544 643 $ US | 1 024 744 000 $ US |
| 1984 | 2 442 157 927 $ US | 1 251 517 600 $ US |
| 1983 | 2 728 450 851 $ US | - |
| 1982 | 2 802 367 063 $ US | - |
| 1981 | 2 425 976 885 $ US | - |
| 1980 | 3 298 027 746 $ US | 574 441 000 $ US |
| 1979 | 2 586 031 059 $ US | 1 223 020 000 $ US |
| 1978 | 1 630 117 686 $ US | - |
| 1977 | 1 237 511 840 $ US | - |
| 1976 | 1 471 465 350 $ US | - |
| 1975 | 1 444 445 641 $ US | - |
| 1974 | 2 227 397 999 $ US | - |
| 1973 | 2 386 716 877 $ US | - |
| 1972 | 1 493 838 677 $ US | - |
| 1971 | 781 035 857 $ US | - |
| 1970 | 439 755 730 $ US | - |
| 1969 | 245 673 600 $ US | - |
| 1968 | 142 104 900 $ US | - |
| 1967 | 119 539 200 $ US | - |
| 1966 | 131 543 660 $ US | - |
| 1965 | 141 387 680 $ US | - |
| 1964 | 142 339 680 $ US | - |
| 1963 | 178 272 880 $ US | - |
| 1962 | 190 280 000 $ US | - |
| 1961 | 195 570 000 $ US | - |
| 1960 | 205 127 600 $ US | - |
En 2025, les réserves de change de la Turquie s'élevaient à 186 milliards de dollars et celles de la Pologne à 272 milliards de dollars : celles de la Pologne étaient supérieures de 46 %. En 1979, les réserves de la Turquie étaient 2,1 fois plus élevées : 2,59 milliards de dollars pour la Turquie et 1,22 milliard de dollars pour la Pologne.
Les réserves de change de la Pologne sont supérieures à celles de la Turquie chaque année depuis 2016.
Turquie vs Pologne : réserves, or compris, et mois d'importations couverts
|
Turquie
|
Pologne
|
|
|---|---|---|
| Réserves, or compris | 186 Md $US | 272 Md $US |
| Mois d'importations | 5,6 | 6,7 |
| Rang mondial | 20/168 | 16/168 |
| Écart des réserves | 0,68× | 1,5× |
Comparer les réserves de change de 2 pays au choix
Sources :
- Banque mondiale | Économie et croissance (1960–2025, mis à jour en octobre 2026)
Creative Commons Attribution (CC BY) : vous pouvez copier, partager, adapter et réutiliser ce contenu, y compris à des fins commerciales, à condition de citer statistics.wiki et d’indiquer les modifications apportées. Les sources citées ci-dessus peuvent avoir leurs propres conditions de licence.