
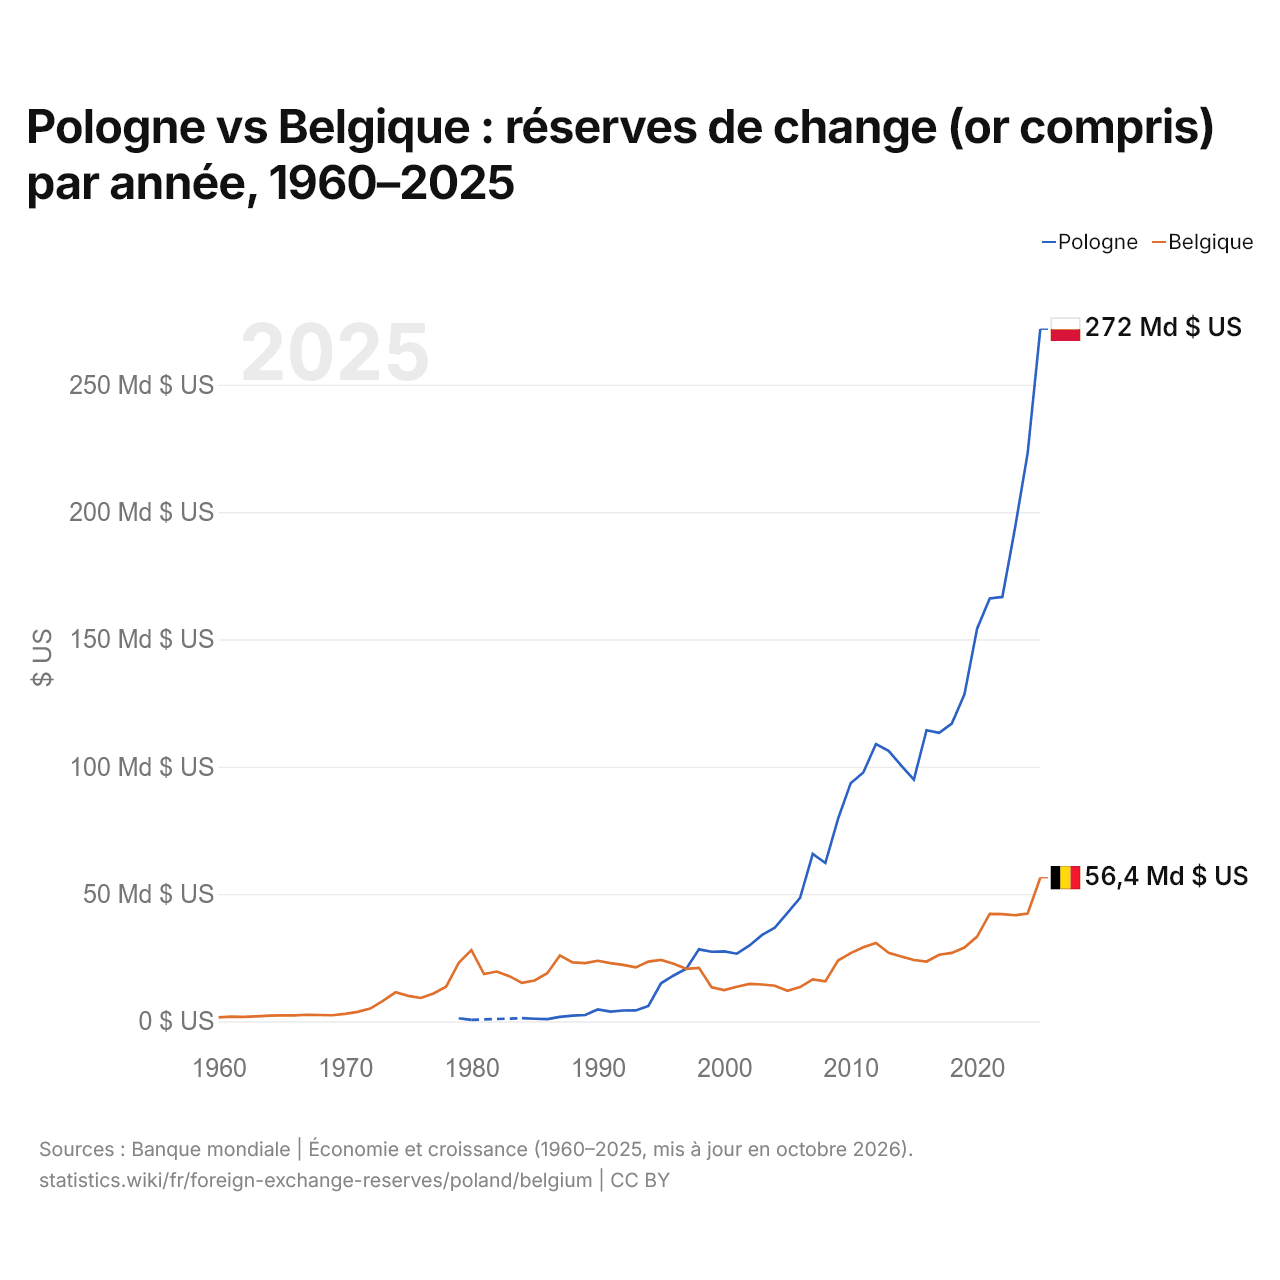
Pologne vs Belgique : réserves de change (or compris) par année, 1960–2025
| Année | $ US | |
|---|---|---|
 Pologne |
 Belgique |
|
| 2025 | 271 805 173 253 $ US | 56 392 530 499 $ US |
| 2024 | 223 114 909 804 $ US | 42 330 768 016 $ US |
| 2023 | 193 783 277 723 $ US | 41 674 984 631 $ US |
| 2022 | 166 663 927 036 $ US | 42 101 229 345 $ US |
| 2021 | 166 030 186 476 $ US | 42 216 681 553 $ US |
| 2020 | 154 219 192 491 $ US | 33 296 227 565 $ US |
| 2019 | 128 392 157 887 $ US | 28 969 986 952 $ US |
| 2018 | 116 956 636 328 $ US | 26 856 799 009 $ US |
| 2017 | 113 267 368 075 $ US | 26 151 437 584 $ US |
| 2016 | 114 328 539 233 $ US | 23 480 922 147 $ US |
| 2015 | 94 902 630 299 $ US | 24 101 851 039 $ US |
| 2014 | 100 452 420 334 $ US | 25 444 391 273 $ US |
| 2013 | 106 221 491 036 $ US | 26 946 175 032 $ US |
| 2012 | 108 902 203 544 $ US | 30 768 939 404 $ US |
| 2011 | 97 712 435 349 $ US | 29 114 266 148 $ US |
| 2010 | 93 472 504 101 $ US | 26 779 063 929 $ US |
| 2009 | 79 521 599 626 $ US | 23 861 674 313 $ US |
| 2008 | 62 183 606 684 $ US | 15 680 647 981 $ US |
| 2007 | 65 724 834 525 $ US | 16 485 311 239 $ US |
| 2006 | 48 473 948 179 $ US | 13 436 681 104 $ US |
| 2005 | 42 560 656 301 $ US | 11 996 383 513 $ US |
| 2004 | 36 772 763 413 $ US | 13 990 812 128 $ US |
| 2003 | 33 958 963 963 $ US | 14 448 826 871 $ US |
| 2002 | 29 783 862 625 $ US | 14 697 923 742 $ US |
| 2001 | 26 563 086 840 $ US | 13 560 301 157 $ US |
| 2000 | 27 469 379 417 $ US | 12 271 745 172 $ US |
| 1999 | 27 314 254 943 $ US | 13 346 240 662 $ US |
| 1998 | 28 276 350 178 $ US | 21 012 750 278 $ US |
| 1997 | 20 669 498 321 $ US | 20 635 950 073 $ US |
| 1996 | 18 018 685 658 $ US | 22 609 776 070 $ US |
| 1995 | 14 957 023 987 $ US | 24 120 463 000 $ US |
| 1994 | 6 023 061 698 $ US | 23 474 024 354 $ US |
| 1993 | 4 276 726 019 $ US | 21 197 694 512 $ US |
| 1992 | 4 256 740 152 $ US | 22 146 931 621 $ US |
| 1991 | 3 799 891 432 $ US | 22 868 663 721 $ US |
| 1990 | 4 673 859 368 $ US | 23 788 895 634 $ US |
| 1989 | 2 503 603 416 $ US | 22 886 849 283 $ US |
| 1988 | 2 248 959 113 $ US | 23 145 049 666 $ US |
| 1987 | 1 723 208 693 $ US | 25 898 989 384 $ US |
| 1986 | 882 302 656 $ US | 18 899 783 761 $ US |
| 1985 | 1 024 744 000 $ US | 16 026 466 437 $ US |
| 1984 | 1 251 517 600 $ US | 15 102 823 617 $ US |
| 1983 | - | 17 754 310 163 $ US |
| 1982 | - | 19 545 394 588 $ US |
| 1981 | - | 18 539 741 074 $ US |
| 1980 | 574 441 000 $ US | 27 973 532 283 $ US |
| 1979 | 1 223 020 000 $ US | 22 959 057 237 $ US |
| 1978 | - | 13 591 056 963 $ US |
| 1977 | - | 10 958 484 439 $ US |
| 1976 | - | 9 173 446 261 $ US |
| 1975 | - | 9 983 533 481 $ US |
| 1974 | - | 11 403 306 217 $ US |
| 1973 | - | 8 052 357 419 $ US |
| 1972 | - | 5 028 350 688 $ US |
| 1971 | - | 3 721 848 719 $ US |
| 1970 | - | 2 946 532 105 $ US |
| 1969 | - | 2 395 121 264 $ US |
| 1968 | - | 2 486 675 902 $ US |
| 1967 | - | 2 597 706 014 $ US |
| 1966 | - | 2 357 973 398 $ US |
| 1965 | - | 2 339 311 318 $ US |
| 1964 | - | 2 227 003 947 $ US |
| 1963 | - | 1 973 351 171 $ US |
| 1962 | - | 1 756 067 570 $ US |
| 1961 | - | 1 819 222 318 $ US |
| 1960 | - | 1 526 945 821 $ US |
En 2025, les réserves de change de la Pologne s'élevaient à 272 milliards de dollars et celles de la Belgique à 56,4 milliards de dollars : celles de la Pologne étaient 4,8 fois plus élevées. En 1979, les réserves de la Belgique étaient 19 fois plus élevées : 1,22 milliard de dollars pour la Pologne et 23 milliards de dollars pour la Belgique.
Les réserves de change de la Pologne sont supérieures à celles de la Belgique chaque année depuis 1997.
Pologne vs Belgique : réserves, or compris, et mois d'importations couverts
|
Pologne
|
Belgique
|
|
|---|---|---|
| Réserves, or compris | 272 Md $US | 56,4 Md $US |
| Mois d'importations | 6,7 | 1,2 |
| Rang mondial | 16/168 | 45/168 |
| Écart des réserves | 4,8× | 0,21× |
Comparer les réserves de change de 2 pays au choix
Sources :
- Banque mondiale | Économie et croissance (1960–2025, mis à jour en octobre 2026)
Creative Commons Attribution (CC BY) : vous pouvez copier, partager, adapter et réutiliser ce contenu, y compris à des fins commerciales, à condition de citer statistics.wiki et d’indiquer les modifications apportées. Les sources citées ci-dessus peuvent avoir leurs propres conditions de licence.