
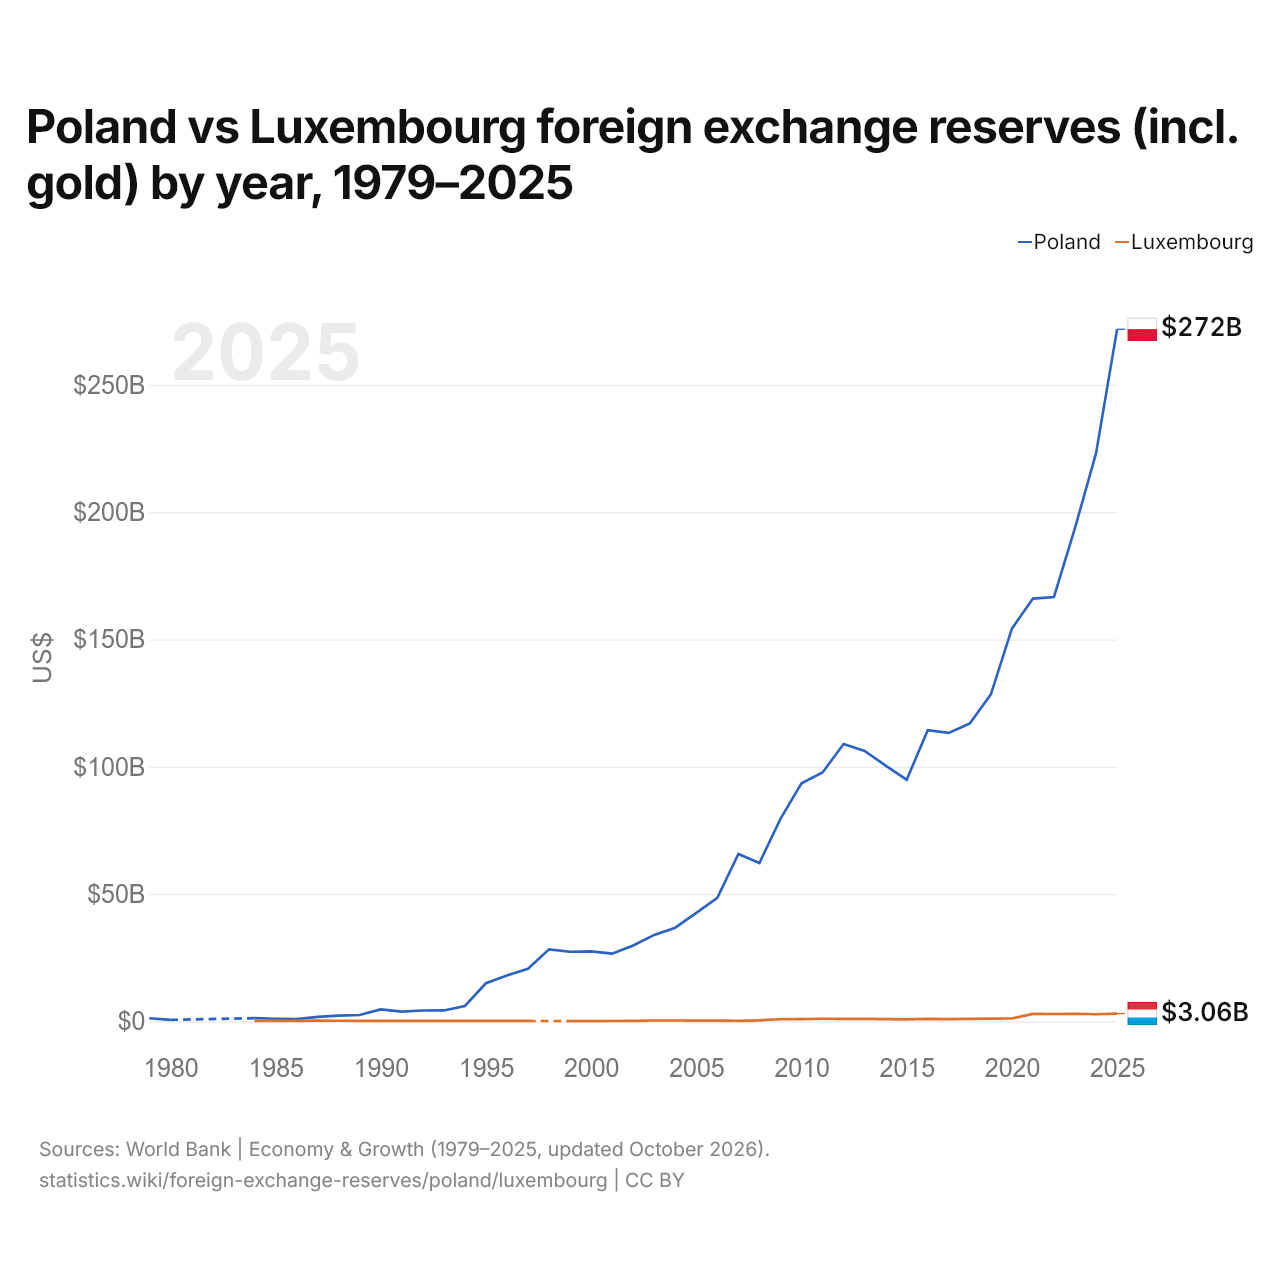
Pologne vs Luxembourg : réserves de change (or compris) par année, 1979–2025
1x
| Année | $ US | |
|---|---|---|
 Pologne |
 Luxembourg |
|
| 2025 | 271 805 173 253 $ US | 3 055 208 157 $ US |
| 2024 | 223 114 909 804 $ US | 2 789 187 310 $ US |
| 2023 | 193 783 277 723 $ US | 2 977 386 521 $ US |
| 2022 | 166 663 927 036 $ US | 2 873 502 279 $ US |
| 2021 | 166 030 186 476 $ US | 2 920 761 393 $ US |
| 2020 | 154 219 192 491 $ US | 1 119 076 142 $ US |
| 2019 | 128 392 157 887 $ US | 1 054 874 473 $ US |
| 2018 | 116 956 636 328 $ US | 938 890 224 $ US |
| 2017 | 113 267 368 075 $ US | 878 080 634 $ US |
| 2016 | 114 328 539 233 $ US | 973 176 553 $ US |
| 2015 | 94 902 630 299 $ US | 770 747 330 $ US |
| 2014 | 100 452 420 334 $ US | 863 655 854 $ US |
| 2013 | 106 221 491 036 $ US | 963 140 967 $ US |
| 2012 | 108 902 203 544 $ US | 990 807 493 $ US |
| 2011 | 97 712 435 349 $ US | 1 010 733 835 $ US |
| 2010 | 93 472 504 101 $ US | 848 320 495 $ US |
| 2009 | 79 521 599 626 $ US | 808 815 187 $ US |
| 2008 | 62 183 606 684 $ US | 398 118 063 $ US |
| 2007 | 65 724 834 525 $ US | 205 249 438 $ US |
| 2006 | 48 473 948 179 $ US | 265 117 814 $ US |
| 2005 | 42 560 656 301 $ US | 279 062 531 $ US |
| 2004 | 36 772 763 413 $ US | 330 783 823 $ US |
| 2003 | 33 958 963 963 $ US | 311 200 498 $ US |
| 2002 | 29 783 862 625 $ US | 177 769 574 $ US |
| 2001 | 26 563 086 840 $ US | 126 635 651 $ US |
| 2000 | 27 469 379 417 $ US | 97 465 748 $ US |
| 1999 | 27 314 254 943 $ US | 99 459 013 $ US |
| 1998 | 28 276 350 178 $ US | - |
| 1997 | 20 669 498 321 $ US | 152 705 860 $ US |
| 1996 | 18 018 685 658 $ US | 186 468 101 $ US |
| 1995 | 14 957 023 987 $ US | 193 112 068 $ US |
| 1994 | 6 023 061 698 $ US | 192 791 166 $ US |
| 1993 | 4 276 726 019 $ US | 186 694 495 $ US |
| 1992 | 4 256 740 152 $ US | 188 412 839 $ US |
| 1991 | 3 799 891 432 $ US | 201 722 868 $ US |
| 1990 | 4 673 859 368 $ US | 212 608 854 $ US |
| 1989 | 2 503 603 416 $ US | 212 809 593 $ US |
| 1988 | 2 248 959 113 $ US | 217 220 857 $ US |
| 1987 | 1 723 208 693 $ US | 250 498 073 $ US |
| 1986 | 882 302 656 $ US | 204 104 121 $ US |
| 1985 | 1 024 744 000 $ US | 173 019 101 $ US |
| 1984 | 1 251 517 600 $ US | 160 844 598 $ US |
| 1983 | - | - |
| 1982 | - | - |
| 1981 | - | - |
| 1980 | 574 441 000 $ US | - |
| 1979 | 1 223 020 000 $ US | - |
En 2025, les réserves de change de la Pologne s'élevaient à 272 milliards de dollars et celles du Luxembourg à 3,06 milliards de dollars : celles de la Pologne étaient 89 fois plus élevées. En 1984, les réserves de la Pologne étaient 7,8 fois plus élevées : 1,25 milliard de dollars pour la Pologne et 161 millions de dollars pour le Luxembourg.
Pologne vs Luxembourg : réserves, or compris, et mois d'importations couverts
|
Pologne
|
Luxembourg
|
|
|---|---|---|
| Réserves, or compris | 272 Md $US | 3,06 Md $US |
| Mois d'importations | 6,7 | 0,2 |
| Rang mondial | 16/168 | 117/168 |
| Écart des réserves | 89× | 0,011× |
Comparer les réserves de change de 2 pays au choix
Sources :
- Banque mondiale | Économie et croissance (1979–2025, mis à jour en octobre 2026)
Creative Commons Attribution (CC BY) : vous pouvez copier, partager, adapter et réutiliser ce contenu, y compris à des fins commerciales, à condition de citer statistics.wiki et d’indiquer les modifications apportées. Les sources citées ci-dessus peuvent avoir leurs propres conditions de licence.