
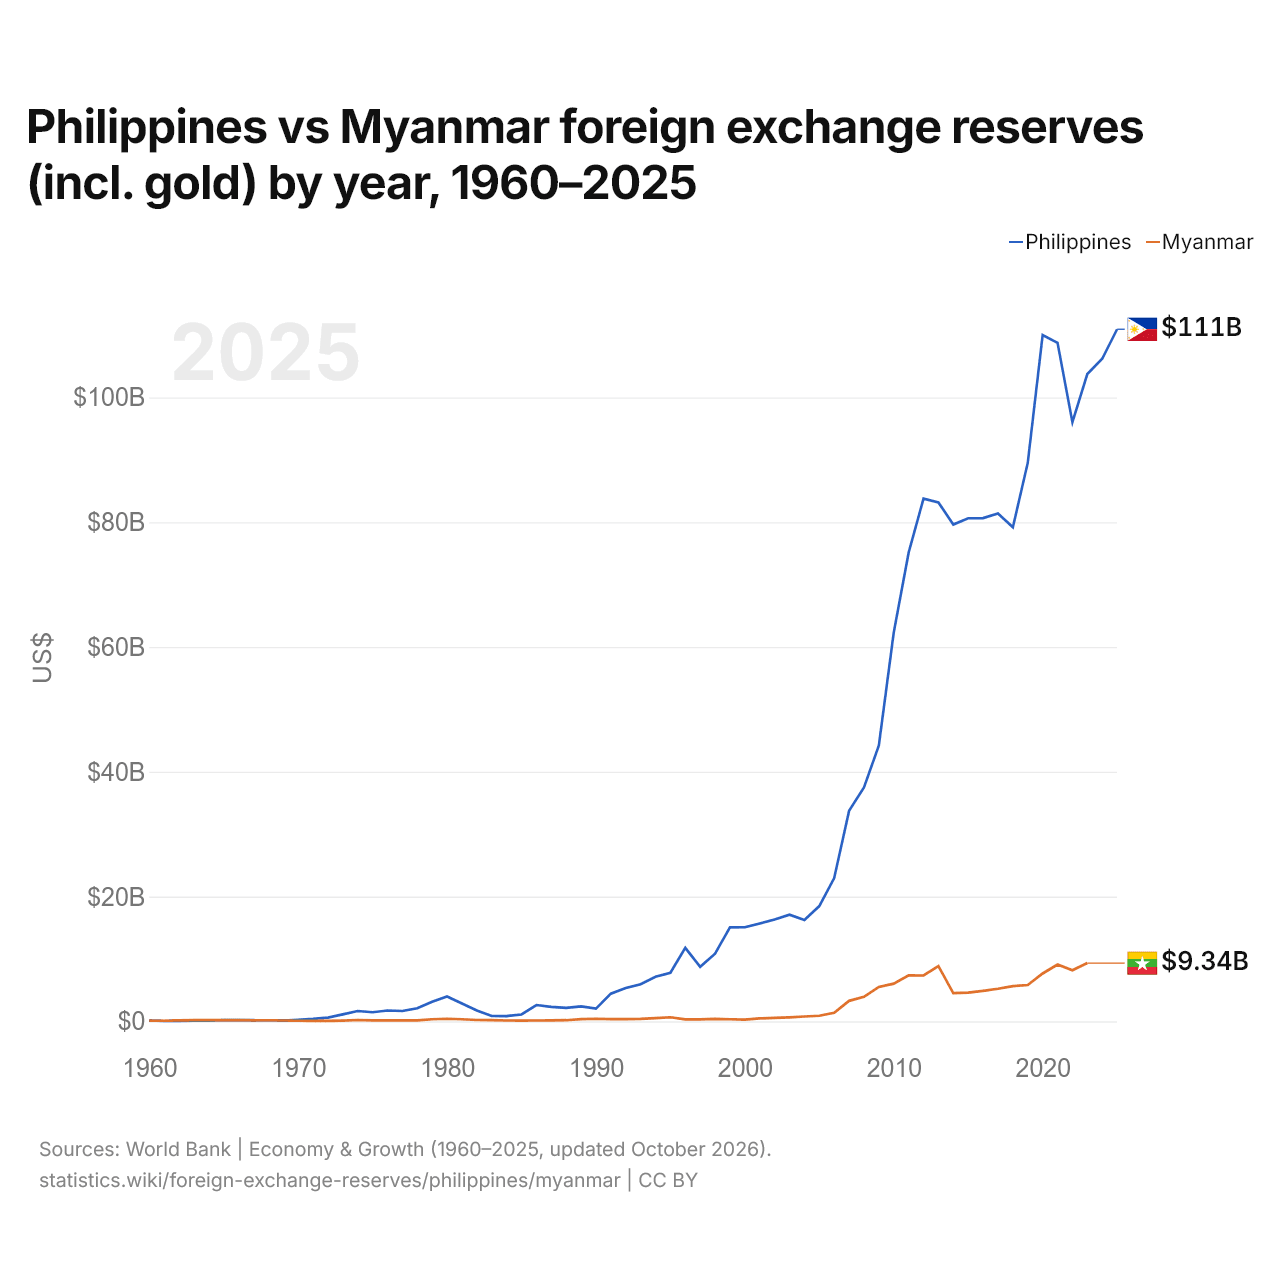
Philippines vs Birmanie : réserves de change (or compris) par année, 1960–2025
| Année | $ US | |
|---|---|---|
 Philippines |
 Birmanie |
|
| 2025 | 110 928 780 532 $ US | - |
| 2024 | 106 195 050 244 $ US | - |
| 2023 | 103 742 233 309 $ US | 9 337 819 633 $ US |
| 2022 | 96 040 188 241 $ US | 8 181 951 381 $ US |
| 2021 | 108 754 857 244 $ US | 9 103 432 839 $ US |
| 2020 | 109 990 274 219 $ US | 7 670 070 785 $ US |
| 2019 | 89 515 298 356 $ US | 5 824 261 144 $ US |
| 2018 | 79 195 598 850 $ US | 5 646 407 387 $ US |
| 2017 | 81 413 504 334 $ US | 5 213 962 531 $ US |
| 2016 | 80 666 223 157 $ US | 4 886 384 704 $ US |
| 2015 | 80 640 411 491 $ US | 4 598 610 942 $ US |
| 2014 | 79 629 428 309 $ US | 4 509 489 139 $ US |
| 2013 | 83 182 370 907 $ US | 8 835 555 373 $ US |
| 2012 | 83 788 600 501 $ US | 7 352 900 705 $ US |
| 2011 | 75 123 089 217 $ US | 7 361 702 603 $ US |
| 2010 | 62 326 286 865 $ US | 6 045 321 167 $ US |
| 2009 | 44 205 983 462 $ US | 5 505 842 339 $ US |
| 2008 | 37 497 616 849 $ US | 3 920 716 171 $ US |
| 2007 | 33 740 202 689 $ US | 3 283 726 257 $ US |
| 2006 | 22 963 020 102 $ US | 1 382 707 355 $ US |
| 2005 | 18 474 495 450 $ US | 889 437 363 $ US |
| 2004 | 16 234 405 946 $ US | 773 487 466 $ US |
| 2003 | 17 083 609 600 $ US | 646 775 821 $ US |
| 2002 | 16 321 045 088 $ US | 549 300 679 $ US |
| 2001 | 15 682 884 965 $ US | 464 440 901 $ US |
| 2000 | 15 074 070 181 $ US | 286 495 285 $ US |
| 1999 | 15 068 981 177 $ US | 332 626 825 $ US |
| 1998 | 10 837 475 986 $ US | 381 515 599 $ US |
| 1997 | 8 744 996 385 $ US | 316 969 699 $ US |
| 1996 | 11 775 610 818 $ US | 314 633 169 $ US |
| 1995 | 7 780 874 730 $ US | 650 646 172 $ US |
| 1994 | 7 146 366 452 $ US | 518 318 938 $ US |
| 1993 | 5 933 972 261 $ US | 401 045 513 $ US |
| 1992 | 5 335 691 451 $ US | 363 826 150 $ US |
| 1991 | 4 436 166 963 $ US | 347 210 276 $ US |
| 1990 | 2 036 231 453 $ US | 409 508 688 $ US |
| 1989 | 2 398 209 047 $ US | 364 109 432 $ US |
| 1988 | 2 168 908 187 $ US | 180 489 370 $ US |
| 1987 | 2 312 132 635 $ US | 148 847 786 $ US |
| 1986 | 2 611 227 693 $ US | 131 294 080 $ US |
| 1985 | 1 098 200 552 $ US | 116 064 368 $ US |
| 1984 | 844 406 804 $ US | 139 557 417 $ US |
| 1983 | 857 185 291 $ US | 185 192 901 $ US |
| 1982 | 1 740 333 169 $ US | 219 116 064 $ US |
| 1981 | 2 858 396 304 $ US | 328 874 525 $ US |
| 1980 | 3 977 980 295 $ US | 408 656 874 $ US |
| 1979 | 3 121 121 356 $ US | 331 879 514 $ US |
| 1978 | 2 104 978 569 $ US | 150 230 452 $ US |
| 1977 | 1 653 546 123 $ US | 140 482 275 $ US |
| 1976 | 1 739 096 909 $ US | 145 252 969 $ US |
| 1975 | 1 462 602 771 $ US | 160 822 339 $ US |
| 1974 | 1 655 870 735 $ US | 219 574 804 $ US |
| 1973 | 1 111 431 651 $ US | 114 339 487 $ US |
| 1972 | 600 318 225 $ US | 60 969 732 $ US |
| 1971 | 392 507 820 $ US | 75 767 502 $ US |
| 1970 | 254 792 000 $ US | 98 344 618 $ US |
| 1969 | 121 267 200 $ US | 129 698 720 $ US |
| 1968 | 173 204 900 $ US | 169 002 340 $ US |
| 1967 | 180 332 800 $ US | 155 498 720 $ US |
| 1966 | 193 733 830 $ US | 184 364 834 $ US |
| 1965 | 193 590 320 $ US | 180 797 632 $ US |
| 1964 | 123 073 840 $ US | 214 887 632 $ US |
| 1963 | 109 064 000 $ US | 184 796 000 $ US |
| 1962 | 75 066 970 $ US | 154 184 000 $ US |
| 1961 | 53 690 650 $ US | 94 990 000 $ US |
| 1960 | 126 942 400 $ US | 121 690 000 $ US |
Les réserves de change des Philippines s'élevaient à 104 milliards de dollars (2023) et celles de la Birmanie à 9,34 milliards de dollars (2023) : celles des Philippines étaient 11 fois plus élevées. En 1960, les réserves des Philippines étaient supérieures de 4,3 % : 127 millions de dollars pour les Philippines et 122 millions de dollars pour la Birmanie.
Les réserves de change des Philippines sont supérieures à celles de la Birmanie chaque année depuis 1970.
Philippines vs Birmanie : réserves, or compris, et mois d'importations couverts
|
Philippines
|
Birmanie
|
|
|---|---|---|
| Réserves, or compris | 111 Md $US (2025) | 9,34 Md $US (2023) |
| Mois d'importations | 6,8 (2025) | n.d. |
| Rang mondial | 28/168 | 84/168 |
Comparer les réserves de change de 2 pays au choix
Sources :
- Banque mondiale | Économie et croissance (1960–2025, mis à jour en octobre 2026)
Creative Commons Attribution (CC BY) : vous pouvez copier, partager, adapter et réutiliser ce contenu, y compris à des fins commerciales, à condition de citer statistics.wiki et d’indiquer les modifications apportées. Les sources citées ci-dessus peuvent avoir leurs propres conditions de licence.