
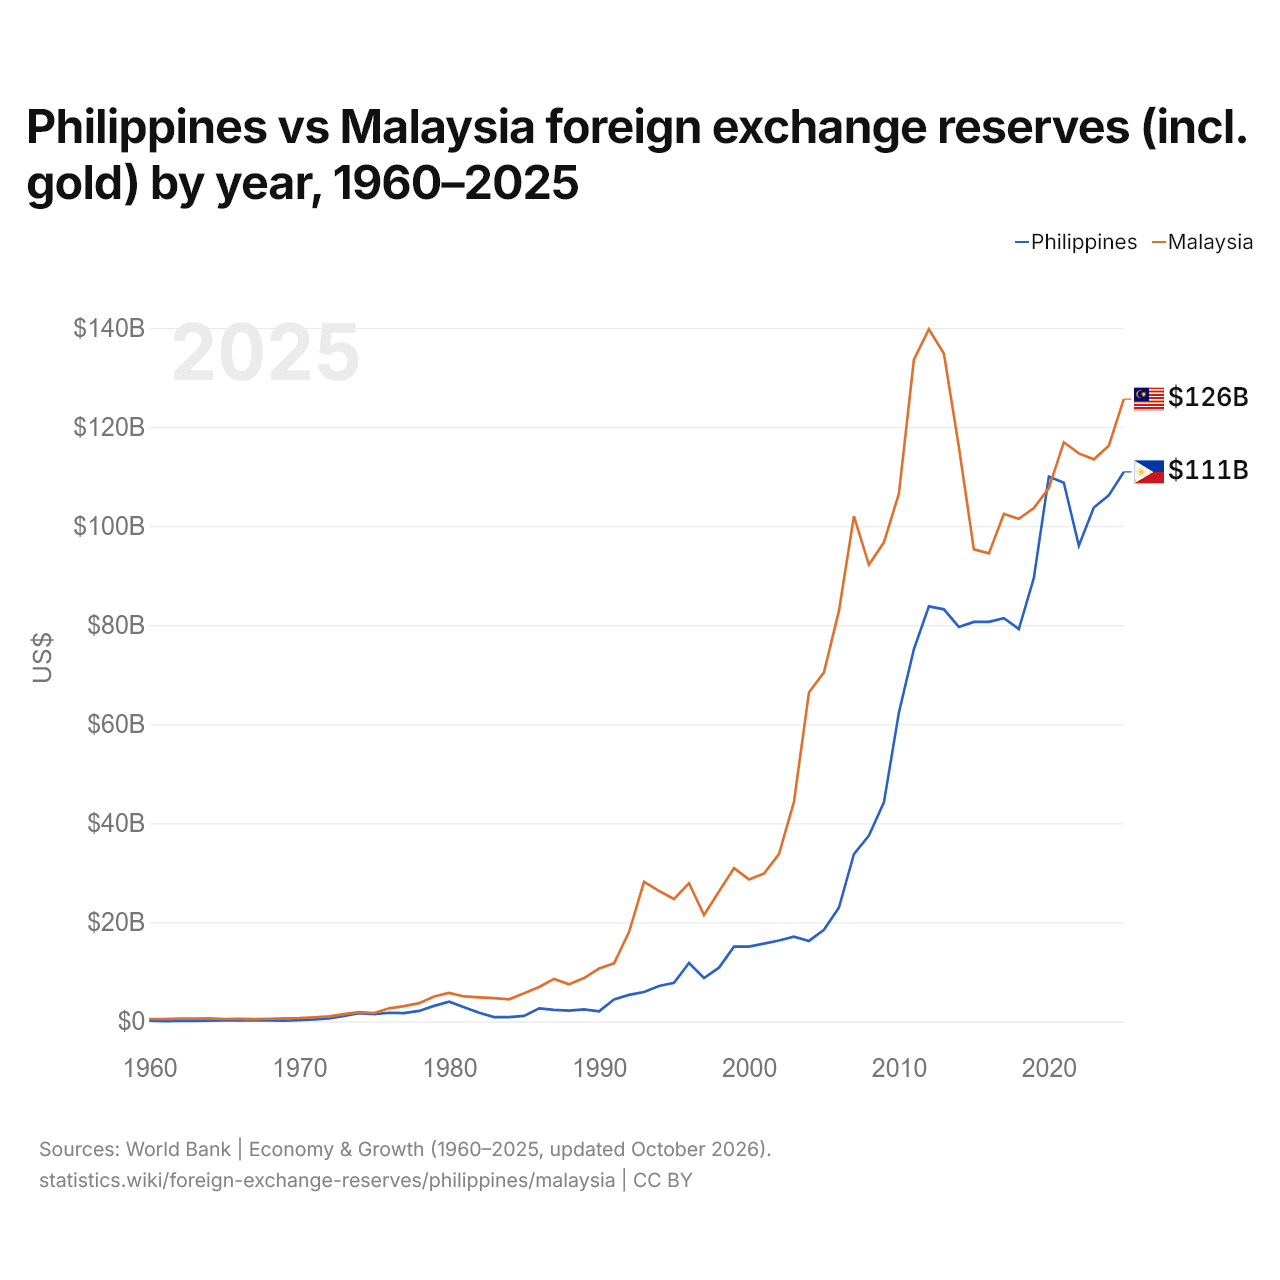
Philippines vs Malaisie : réserves de change (or compris) par année, 1960–2025
| Année | $ US | |
|---|---|---|
 Philippines |
 Malaisie |
|
| 2025 | 110 928 780 532 $ US | 125 629 250 346 $ US |
| 2024 | 106 195 050 244 $ US | 116 229 205 258 $ US |
| 2023 | 103 742 233 309 $ US | 113 462 632 024 $ US |
| 2022 | 96 040 188 241 $ US | 114 658 812 345 $ US |
| 2021 | 108 754 857 244 $ US | 116 915 867 600 $ US |
| 2020 | 109 990 274 219 $ US | 107 643 865 229 $ US |
| 2019 | 89 515 298 356 $ US | 103 629 721 169 $ US |
| 2018 | 79 195 598 850 $ US | 101 452 531 755 $ US |
| 2017 | 81 413 504 334 $ US | 102 446 599 681 $ US |
| 2016 | 80 666 223 157 $ US | 94 481 267 074 $ US |
| 2015 | 80 640 411 491 $ US | 95 282 342 268 $ US |
| 2014 | 79 629 428 309 $ US | 115 958 875 076 $ US |
| 2013 | 83 182 370 907 $ US | 134 853 702 252 $ US |
| 2012 | 83 788 600 501 $ US | 139 730 782 666 $ US |
| 2011 | 75 123 089 217 $ US | 133 571 684 232 $ US |
| 2010 | 62 326 286 865 $ US | 106 528 123 470 $ US |
| 2009 | 44 205 983 462 $ US | 96 704 054 215 $ US |
| 2008 | 37 497 616 849 $ US | 92 166 457 065 $ US |
| 2007 | 33 740 202 689 $ US | 101 994 768 945 $ US |
| 2006 | 22 963 020 102 $ US | 82 876 090 883 $ US |
| 2005 | 18 474 495 450 $ US | 70 458 190 075 $ US |
| 2004 | 16 234 405 946 $ US | 66 393 546 884 $ US |
| 2003 | 17 083 609 600 $ US | 44 309 888 491 $ US |
| 2002 | 16 321 045 088 $ US | 33 761 683 388 $ US |
| 2001 | 15 682 884 965 $ US | 29 845 803 174 $ US |
| 2000 | 15 074 070 181 $ US | 28 650 936 564 $ US |
| 1999 | 15 068 981 177 $ US | 30 930 646 966 $ US |
| 1998 | 10 837 475 986 $ US | 26 235 700 001 $ US |
| 1997 | 8 744 996 385 $ US | 21 470 190 358 $ US |
| 1996 | 11 775 610 818 $ US | 27 891 908 787 $ US |
| 1995 | 7 780 874 730 $ US | 24 698 750 841 $ US |
| 1994 | 7 146 366 452 $ US | 26 338 865 721 $ US |
| 1993 | 5 933 972 261 $ US | 28 182 868 224 $ US |
| 1992 | 5 335 691 451 $ US | 18 023 989 163 $ US |
| 1991 | 4 436 166 963 $ US | 11 716 563 985 $ US |
| 1990 | 2 036 231 453 $ US | 10 658 831 703 $ US |
| 1989 | 2 398 209 047 $ US | 8 733 335 043 $ US |
| 1988 | 2 168 908 187 $ US | 7 490 586 592 $ US |
| 1987 | 2 312 132 635 $ US | 8 572 963 846 $ US |
| 1986 | 2 611 227 693 $ US | 6 942 091 429 $ US |
| 1985 | 1 098 200 552 $ US | 5 677 019 192 $ US |
| 1984 | 844 406 804 $ US | 4 441 615 351 $ US |
| 1983 | 857 185 291 $ US | 4 672 616 248 $ US |
| 1982 | 1 740 333 169 $ US | 4 832 354 978 $ US |
| 1981 | 2 858 396 304 $ US | 5 024 212 852 $ US |
| 1980 | 3 977 980 295 $ US | 5 754 999 182 $ US |
| 1979 | 3 121 121 356 $ US | 5 005 509 362 $ US |
| 1978 | 2 104 978 569 $ US | 3 670 453 192 $ US |
| 1977 | 1 653 546 123 $ US | 3 070 865 971 $ US |
| 1976 | 1 739 096 909 $ US | 2 627 815 149 $ US |
| 1975 | 1 462 602 771 $ US | 1 688 955 830 $ US |
| 1974 | 1 655 870 735 $ US | 1 856 664 245 $ US |
| 1973 | 1 111 431 651 $ US | 1 461 558 717 $ US |
| 1972 | 600 318 225 $ US | 1 014 857 175 $ US |
| 1971 | 392 507 820 $ US | 827 084 342 $ US |
| 1970 | 254 792 000 $ US | 667 456 900 $ US |
| 1969 | 121 267 200 $ US | 619 980 000 $ US |
| 1968 | 173 204 900 $ US | 529 201 000 $ US |
| 1967 | 180 332 800 $ US | 457 018 000 $ US |
| 1966 | 193 733 830 $ US | 494 285 700 $ US |
| 1965 | 193 590 320 $ US | 469 857 200 $ US |
| 1964 | 123 073 840 $ US | 593 424 000 $ US |
| 1963 | 109 064 000 $ US | 555 268 400 $ US |
| 1962 | 75 066 970 $ US | 531 546 300 $ US |
| 1961 | 53 690 650 $ US | 472 000 000 $ US |
| 1960 | 126 942 400 $ US | 471 000 000 $ US |
En 2025, les réserves de change des Philippines s'élevaient à 111 milliards de dollars et celles de la Malaisie à 126 milliards de dollars : celles de la Malaisie étaient supérieures de 13 %. En 1960, les réserves de la Malaisie étaient 3,7 fois plus élevées : 127 millions de dollars pour les Philippines et 471 millions de dollars pour la Malaisie.
Les réserves de change de la Malaisie sont supérieures à celles des Philippines chaque année depuis 2021.
Philippines vs Malaisie : réserves, or compris, et mois d'importations couverts
|
Philippines
|
Malaisie
|
|
|---|---|---|
| Réserves, or compris | 111 Md $US | 126 Md $US |
| Mois d'importations | 6,8 | 4,9 |
| Rang mondial | 28/168 | 25/168 |
| Écart des réserves | 0,88× | 1,1× |
Comparer les réserves de change de 2 pays au choix
Sources :
- Banque mondiale | Économie et croissance (1960–2025, mis à jour en octobre 2026)
Creative Commons Attribution (CC BY) : vous pouvez copier, partager, adapter et réutiliser ce contenu, y compris à des fins commerciales, à condition de citer statistics.wiki et d’indiquer les modifications apportées. Les sources citées ci-dessus peuvent avoir leurs propres conditions de licence.