
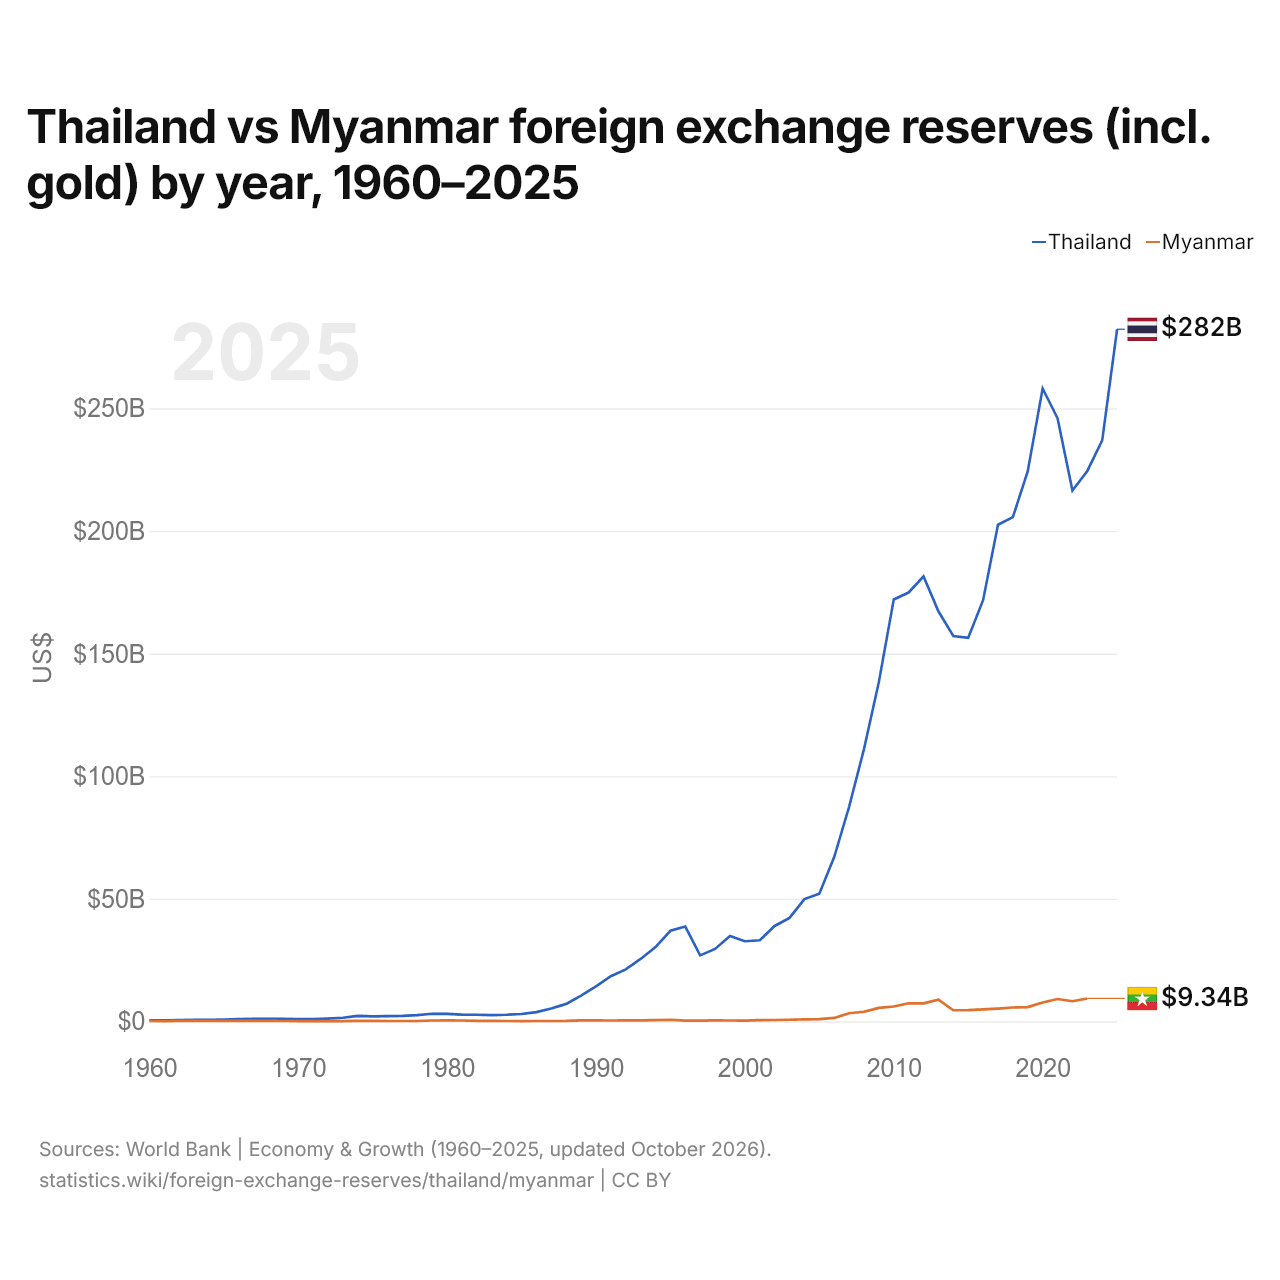
Thaïlande vs Birmanie : réserves de change (or compris) par année, 1960–2025
| Année | $ US | |
|---|---|---|
 Thaïlande |
 Birmanie |
|
| 2025 | 282 261 124 353 $ US | - |
| 2024 | 236 933 974 075 $ US | - |
| 2023 | 224 470 464 419 $ US | 9 337 819 633 $ US |
| 2022 | 216 500 525 687 $ US | 8 181 951 381 $ US |
| 2021 | 246 025 242 649 $ US | 9 103 432 839 $ US |
| 2020 | 258 104 429 789 $ US | 7 670 070 785 $ US |
| 2019 | 224 355 506 655 $ US | 5 824 261 144 $ US |
| 2018 | 205 640 628 938 $ US | 5 646 407 387 $ US |
| 2017 | 202 538 295 197 $ US | 5 213 962 531 $ US |
| 2016 | 171 772 074 487 $ US | 4 886 384 704 $ US |
| 2015 | 156 459 956 383 $ US | 4 598 610 942 $ US |
| 2014 | 157 162 740 027 $ US | 4 509 489 139 $ US |
| 2013 | 167 230 223 498 $ US | 8 835 555 373 $ US |
| 2012 | 181 481 264 054 $ US | 7 352 900 705 $ US |
| 2011 | 174 891 021 491 $ US | 7 361 702 603 $ US |
| 2010 | 172 027 935 376 $ US | 6 045 321 167 $ US |
| 2009 | 138 419 119 048 $ US | 5 505 842 339 $ US |
| 2008 | 111 009 214 972 $ US | 3 920 716 171 $ US |
| 2007 | 87 472 466 803 $ US | 3 283 726 257 $ US |
| 2006 | 67 007 805 168 $ US | 1 382 707 355 $ US |
| 2005 | 52 075 784 294 $ US | 889 437 363 $ US |
| 2004 | 49 846 608 742 $ US | 773 487 466 $ US |
| 2003 | 42 161 780 760 $ US | 646 775 821 $ US |
| 2002 | 38 903 305 774 $ US | 549 300 679 $ US |
| 2001 | 33 040 506 130 $ US | 464 440 901 $ US |
| 2000 | 32 665 494 240 $ US | 286 495 285 $ US |
| 1999 | 34 780 926 366 $ US | 332 626 825 $ US |
| 1998 | 29 537 081 212 $ US | 381 515 599 $ US |
| 1997 | 26 897 418 425 $ US | 316 969 699 $ US |
| 1996 | 38 644 717 231 $ US | 314 633 169 $ US |
| 1995 | 36 938 829 792 $ US | 650 646 172 $ US |
| 1994 | 30 280 316 600 $ US | 518 318 938 $ US |
| 1993 | 25 439 320 808 $ US | 401 045 513 $ US |
| 1992 | 21 183 085 550 $ US | 363 826 150 $ US |
| 1991 | 18 392 698 555 $ US | 347 210 276 $ US |
| 1990 | 14 258 318 642 $ US | 409 508 688 $ US |
| 1989 | 10 508 203 542 $ US | 364 109 432 $ US |
| 1988 | 7 112 347 032 $ US | 180 489 370 $ US |
| 1987 | 5 205 711 201 $ US | 148 847 786 $ US |
| 1986 | 3 776 532 764 $ US | 131 294 080 $ US |
| 1985 | 3 003 322 374 $ US | 116 064 368 $ US |
| 1984 | 2 687 314 836 $ US | 139 557 417 $ US |
| 1983 | 2 555 856 563 $ US | 185 192 901 $ US |
| 1982 | 2 673 865 472 $ US | 219 116 064 $ US |
| 1981 | 2 720 399 131 $ US | 328 874 525 $ US |
| 1980 | 3 026 261 895 $ US | 408 656 874 $ US |
| 1979 | 3 099 793 502 $ US | 331 879 514 $ US |
| 1978 | 2 556 904 312 $ US | 150 230 452 $ US |
| 1977 | 2 208 114 609 $ US | 140 482 275 $ US |
| 1976 | 2 112 848 141 $ US | 145 252 969 $ US |
| 1975 | 2 006 995 026 $ US | 160 822 339 $ US |
| 1974 | 2 194 580 772 $ US | 219 574 804 $ US |
| 1973 | 1 469 494 604 $ US | 114 339 487 $ US |
| 1972 | 1 115 223 907 $ US | 60 969 732 $ US |
| 1971 | 890 056 634 $ US | 75 767 502 $ US |
| 1970 | 911 040 540 $ US | 98 344 618 $ US |
| 1969 | 984 984 000 $ US | 129 698 720 $ US |
| 1968 | 1 038 538 000 $ US | 169 002 340 $ US |
| 1967 | 1 008 984 000 $ US | 155 498 720 $ US |
| 1966 | 923 957 800 $ US | 184 364 834 $ US |
| 1965 | 739 800 720 $ US | 180 797 632 $ US |
| 1964 | 660 812 240 $ US | 214 887 632 $ US |
| 1963 | 576 683 160 $ US | 184 796 000 $ US |
| 1962 | 523 663 390 $ US | 154 184 000 $ US |
| 1961 | 454 901 550 $ US | 94 990 000 $ US |
| 1960 | 373 373 600 $ US | 121 690 000 $ US |
Les réserves de change de la Thaïlande s'élevaient à 224 milliards de dollars (2023) et celles de la Birmanie à 9,34 milliards de dollars (2023) : celles de la Thaïlande étaient 24 fois plus élevées. En 1960, les réserves de la Thaïlande étaient 3,1 fois plus élevées : 373 millions de dollars pour la Thaïlande et 122 millions de dollars pour la Birmanie.
Les réserves de change de la Thaïlande sont supérieures à celles de la Birmanie chaque année depuis 1960.
Thaïlande vs Birmanie : réserves, or compris, et mois d'importations couverts
|
Thaïlande
|
Birmanie
|
|
|---|---|---|
| Réserves, or compris | 282 Md $US (2025) | 9,34 Md $US (2023) |
| Mois d'importations | 8,7 (2025) | n.d. |
| Rang mondial | 15/168 | 84/168 |
Comparer les réserves de change de 2 pays au choix
Sources :
- Banque mondiale | Économie et croissance (1960–2025, mis à jour en octobre 2026)
Creative Commons Attribution (CC BY) : vous pouvez copier, partager, adapter et réutiliser ce contenu, y compris à des fins commerciales, à condition de citer statistics.wiki et d’indiquer les modifications apportées. Les sources citées ci-dessus peuvent avoir leurs propres conditions de licence.