
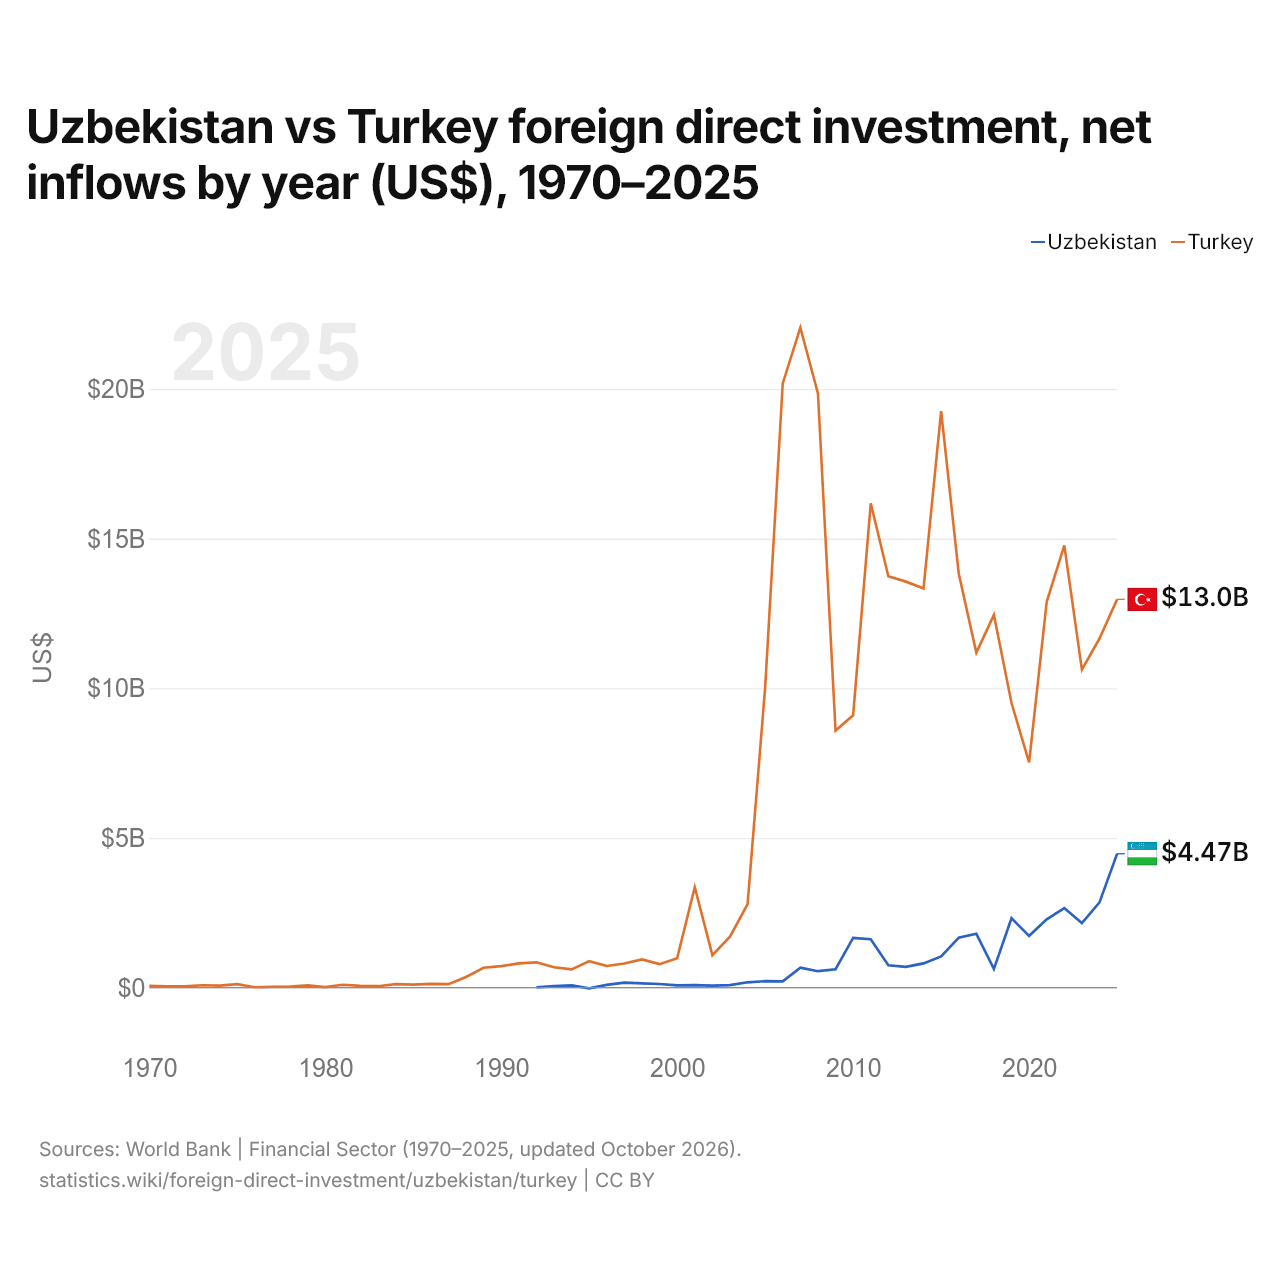
Ouzbékistan vs Turquie : investissements directs étrangers, entrées nettes par année ($ US), 1970–2025
| Année | $ US | |
|---|---|---|
 Ouzbékistan |
 Turquie |
|
| 2025 | 4 472 568 174 $ US | 12 971 000 000 $ US |
| 2024 | 2 847 342 115 $ US | 11 662 000 000 $ US |
| 2023 | 2 156 350 919 $ US | 10 621 000 000 $ US |
| 2022 | 2 657 356 365 $ US | 14 776 000 000 $ US |
| 2021 | 2 280 290 470 $ US | 12 891 000 000 $ US |
| 2020 | 1 728 247 828 $ US | 7 522 000 000 $ US |
| 2019 | 2 316 482 962 $ US | 9 507 000 000 $ US |
| 2018 | 624 686 536 $ US | 12 450 000 000 $ US |
| 2017 | 1 798 299 475 $ US | 11 190 000 000 $ US |
| 2016 | 1 662 886 452 $ US | 13 835 000 000 $ US |
| 2015 | 1 041 199 291 $ US | 19 263 000 000 $ US |
| 2014 | 808 675 997 $ US | 13 337 000 000 $ US |
| 2013 | 691 576 226 $ US | 13 563 000 000 $ US |
| 2012 | 744 244 552 $ US | 13 744 000 000 $ US |
| 2011 | 1 615 052 150 $ US | 16 182 000 000 $ US |
| 2010 | 1 662 748 216 $ US | 9 099 000 000 $ US |
| 2009 | 613 093 923 $ US | 8 585 000 000 $ US |
| 2008 | 547 961 216 $ US | 19 851 000 000 $ US |
| 2007 | 667 503 821 $ US | 22 047 000 000 $ US |
| 2006 | 207 156 423 $ US | 20 185 000 000 $ US |
| 2005 | 213 491 020 $ US | 10 031 000 000 $ US |
| 2004 | 176 600 000 $ US | 2 785 000 000 $ US |
| 2003 | 82 600 000 $ US | 1 702 000 000 $ US |
| 2002 | 65 300 000 $ US | 1 082 000 000 $ US |
| 2001 | 82 800 000 $ US | 3 352 000 000 $ US |
| 2000 | 74 700 000 $ US | 982 000 000 $ US |
| 1999 | 121 200 000 $ US | 783 000 000 $ US |
| 1998 | 139 600 000 $ US | 940 000 000 $ US |
| 1997 | 166 800 000 $ US | 805 000 000 $ US |
| 1996 | 90 000 000 $ US | 722 000 000 $ US |
| 1995 | −24 000 000 $ US | 885 000 000 $ US |
| 1994 | 73 000 000 $ US | 608 000 000 $ US |
| 1993 | 48 000 000 $ US | 678 000 000 $ US |
| 1992 | 9 000 000 $ US | 844 000 000 $ US |
| 1991 | - | 810 000 000 $ US |
| 1990 | - | 715 000 000 $ US |
| 1989 | - | 663 000 000 $ US |
| 1988 | - | 354 000 000 $ US |
| 1987 | - | 115 000 000 $ US |
| 1986 | - | 125 000 000 $ US |
| 1985 | - | 99 000 000 $ US |
| 1984 | - | 113 000 000 $ US |
| 1983 | - | 46 000 000 $ US |
| 1982 | - | 55 000 000 $ US |
| 1981 | - | 95 000 000 $ US |
| 1980 | - | 18 000 000 $ US |
| 1979 | - | 75 000 000 $ US |
| 1978 | - | 34 000 000 $ US |
| 1977 | - | 27 000 000 $ US |
| 1976 | - | 10 000 000 $ US |
| 1975 | - | 114 000 000 $ US |
| 1974 | - | 64 000 000 $ US |
| 1973 | - | 79 000 000 $ US |
| 1972 | - | 43 000 000 $ US |
| 1971 | - | 45 000 000 $ US |
| 1970 | - | 58 000 000 $ US |
En 2025, les entrées nettes d'investissements directs étrangers étaient de 4,47 milliards de dollars en Ouzbékistan et de 13 milliards de dollars en Turquie : 2,9 fois plus en Turquie. En 1992, elles étaient de 9 millions de dollars en Ouzbékistan et de 844 millions de dollars en Turquie.
Les entrées nettes d'investissements directs étrangers en Ouzbékistan ont été inférieures à celles de la Turquie chacune des 34 années de 1992 à 2025.
Ouzbékistan vs Turquie : dernières entrées et sorties d'investissements étrangers
|
Ouzbékistan
|
Turquie
|
|
|---|---|---|
| Entrées nettes | +4,47 Md $US | +13,0 Md $US |
| Entrées nettes, % du PIB | +3,0 % | +0,8 % |
| Sorties nettes | +158 M $US | +9,83 Md $US |
| Entrées nettes, total 2016–2025 | +22,5 Md $US | +117 Md $US |
| Rang mondial | 48/192 | 31/192 |
Comparer les investissements directs étrangers de 2 pays au choix
Sources :
- Banque mondiale | Secteur financier (1970–2025, mis à jour en octobre 2026)
Creative Commons Attribution (CC BY) : vous pouvez copier, partager, adapter et réutiliser ce contenu, y compris à des fins commerciales, à condition de citer statistics.wiki et d’indiquer les modifications apportées. Les sources citées ci-dessus peuvent avoir leurs propres conditions de licence.