
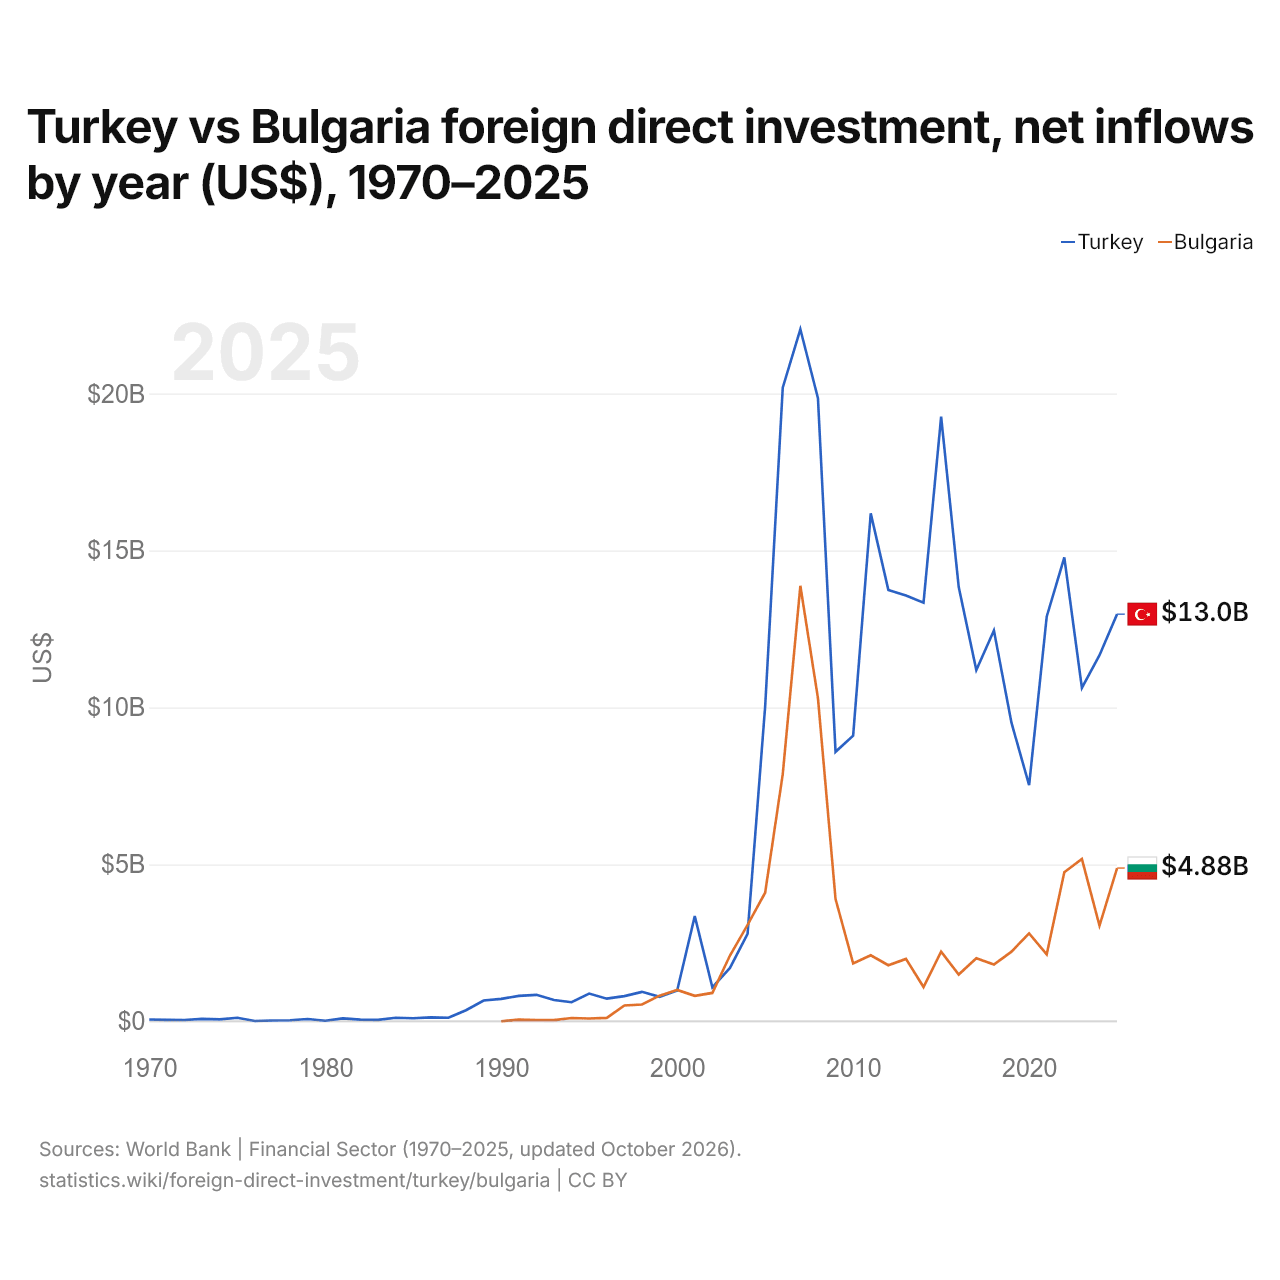
Turquie vs Bulgarie : investissements directs étrangers, entrées nettes par année ($ US), 1970–2025
| Année | $ US | |
|---|---|---|
 Turquie |
 Bulgarie |
|
| 2025 | 12 971 000 000 $ US | 4 883 020 000 $ US |
| 2024 | 11 662 000 000 $ US | 3 050 820 000 $ US |
| 2023 | 10 621 000 000 $ US | 5 170 140 000 $ US |
| 2022 | 14 776 000 000 $ US | 4 748 510 000 $ US |
| 2021 | 12 891 000 000 $ US | 2 133 700 000 $ US |
| 2020 | 7 522 000 000 $ US | 2 801 390 000 $ US |
| 2019 | 9 507 000 000 $ US | 2 221 250 000 $ US |
| 2018 | 12 450 000 000 $ US | 1 809 860 000 $ US |
| 2017 | 11 190 000 000 $ US | 2 007 290 000 $ US |
| 2016 | 13 835 000 000 $ US | 1 488 430 000 $ US |
| 2015 | 19 263 000 000 $ US | 2 221 390 000 $ US |
| 2014 | 13 337 000 000 $ US | 1 093 600 000 $ US |
| 2013 | 13 563 000 000 $ US | 1 989 040 000 $ US |
| 2012 | 13 744 000 000 $ US | 1 788 110 000 $ US |
| 2011 | 16 182 000 000 $ US | 2 103 810 000 $ US |
| 2010 | 9 099 000 000 $ US | 1 842 900 000 $ US |
| 2009 | 8 585 000 000 $ US | 3 896 664 559 $ US |
| 2008 | 19 851 000 000 $ US | 10 296 720 634 $ US |
| 2007 | 22 047 000 000 $ US | 13 875 270 457 $ US |
| 2006 | 20 185 000 000 $ US | 7 874 476 255 $ US |
| 2005 | 10 031 000 000 $ US | 4 098 122 931 $ US |
| 2004 | 2 785 000 000 $ US | 3 072 550 962 $ US |
| 2003 | 1 702 000 000 $ US | 2 096 788 700 $ US |
| 2002 | 1 082 000 000 $ US | 904 659 791 $ US |
| 2001 | 3 352 000 000 $ US | 812 942 202 $ US |
| 2000 | 982 000 000 $ US | 1 001 503 842 $ US |
| 1999 | 783 000 000 $ US | 818 788 155 $ US |
| 1998 | 940 000 000 $ US | 537 317 256 $ US |
| 1997 | 805 000 000 $ US | 504 800 000 $ US |
| 1996 | 722 000 000 $ US | 109 000 000 $ US |
| 1995 | 885 000 000 $ US | 90 400 000 $ US |
| 1994 | 608 000 000 $ US | 105 400 000 $ US |
| 1993 | 678 000 000 $ US | 40 000 000 $ US |
| 1992 | 844 000 000 $ US | 41 500 000 $ US |
| 1991 | 810 000 000 $ US | 55 900 000 $ US |
| 1990 | 715 000 000 $ US | 4 000 000 $ US |
| 1989 | 663 000 000 $ US | - |
| 1988 | 354 000 000 $ US | - |
| 1987 | 115 000 000 $ US | - |
| 1986 | 125 000 000 $ US | - |
| 1985 | 99 000 000 $ US | - |
| 1984 | 113 000 000 $ US | - |
| 1983 | 46 000 000 $ US | - |
| 1982 | 55 000 000 $ US | - |
| 1981 | 95 000 000 $ US | - |
| 1980 | 18 000 000 $ US | - |
| 1979 | 75 000 000 $ US | - |
| 1978 | 34 000 000 $ US | - |
| 1977 | 27 000 000 $ US | - |
| 1976 | 10 000 000 $ US | - |
| 1975 | 114 000 000 $ US | - |
| 1974 | 64 000 000 $ US | - |
| 1973 | 79 000 000 $ US | - |
| 1972 | 43 000 000 $ US | - |
| 1971 | 45 000 000 $ US | - |
| 1970 | 58 000 000 $ US | - |
En 2025, les entrées nettes d'investissements directs étrangers étaient de 13 milliards de dollars en Turquie et de 4,88 milliards de dollars en Bulgarie : 2,7 fois plus en Turquie. En 1990, elles étaient de 715 millions de dollars en Turquie et de 4 millions de dollars en Bulgarie.
Les entrées nettes d'investissements directs étrangers en Turquie ont été supérieures à celles de la Bulgarie pendant 32 des 36 années de 1990 à 2025, et inférieures pendant 4.
Turquie vs Bulgarie : dernières entrées et sorties d'investissements étrangers
|
Turquie
|
Bulgarie
|
|
|---|---|---|
| Entrées nettes | +13,0 Md $US | +4,88 Md $US |
| Entrées nettes, % du PIB | +0,8 % | +3,7 % |
| Sorties nettes | +9,83 Md $US | +1,51 Md $US |
| Entrées nettes, total 2016–2025 | +117 Md $US | +30,3 Md $US |
| Rang mondial | 31/192 | 47/192 |
Comparer les investissements directs étrangers de 2 pays au choix
Sources :
- Banque mondiale | Secteur financier (1970–2025, mis à jour en octobre 2026)
Creative Commons Attribution (CC BY) : vous pouvez copier, partager, adapter et réutiliser ce contenu, y compris à des fins commerciales, à condition de citer statistics.wiki et d’indiquer les modifications apportées. Les sources citées ci-dessus peuvent avoir leurs propres conditions de licence.