
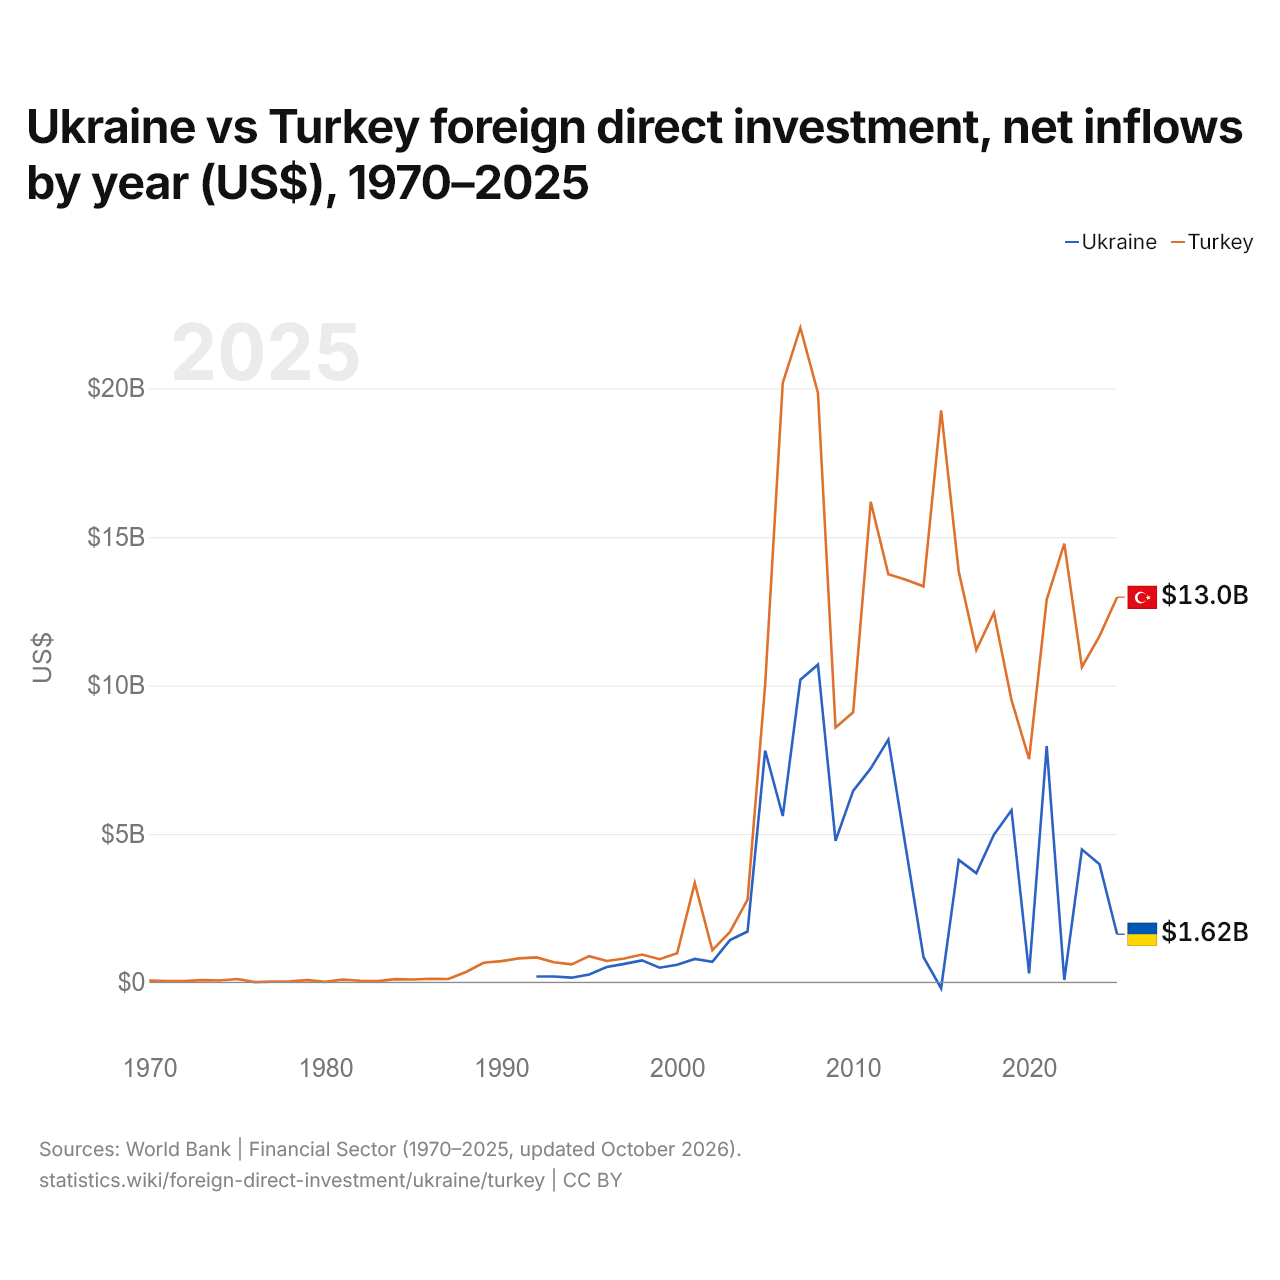
Ukraine vs Turquie : investissements directs étrangers, entrées nettes par année ($ US), 1970–2025
| Année | $ US | |
|---|---|---|
 Ukraine |
 Turquie |
|
| 2025 | 1 623 000 000 $ US | 12 971 000 000 $ US |
| 2024 | 3 977 000 000 $ US | 11 662 000 000 $ US |
| 2023 | 4 474 000 000 $ US | 10 621 000 000 $ US |
| 2022 | 82 000 000 $ US | 14 776 000 000 $ US |
| 2021 | 7 954 000 000 $ US | 12 891 000 000 $ US |
| 2020 | 304 000 000 $ US | 7 522 000 000 $ US |
| 2019 | 5 796 000 000 $ US | 9 507 000 000 $ US |
| 2018 | 4 975 000 000 $ US | 12 450 000 000 $ US |
| 2017 | 3 680 000 000 $ US | 11 190 000 000 $ US |
| 2016 | 4 128 000 000 $ US | 13 835 000 000 $ US |
| 2015 | −198 000 000 $ US | 19 263 000 000 $ US |
| 2014 | 847 000 000 $ US | 13 337 000 000 $ US |
| 2013 | 4 509 000 000 $ US | 13 563 000 000 $ US |
| 2012 | 8 175 000 000 $ US | 13 744 000 000 $ US |
| 2011 | 7 207 000 000 $ US | 16 182 000 000 $ US |
| 2010 | 6 451 000 000 $ US | 9 099 000 000 $ US |
| 2009 | 4 769 000 000 $ US | 8 585 000 000 $ US |
| 2008 | 10 700 000 000 $ US | 19 851 000 000 $ US |
| 2007 | 10 193 000 000 $ US | 22 047 000 000 $ US |
| 2006 | 5 604 000 000 $ US | 20 185 000 000 $ US |
| 2005 | 7 808 000 000 $ US | 10 031 000 000 $ US |
| 2004 | 1 715 000 000 $ US | 2 785 000 000 $ US |
| 2003 | 1 424 000 000 $ US | 1 702 000 000 $ US |
| 2002 | 693 000 000 $ US | 1 082 000 000 $ US |
| 2001 | 792 000 000 $ US | 3 352 000 000 $ US |
| 2000 | 595 000 000 $ US | 982 000 000 $ US |
| 1999 | 496 000 000 $ US | 783 000 000 $ US |
| 1998 | 743 000 000 $ US | 940 000 000 $ US |
| 1997 | 623 000 000 $ US | 805 000 000 $ US |
| 1996 | 521 000 000 $ US | 722 000 000 $ US |
| 1995 | 267 000 000 $ US | 885 000 000 $ US |
| 1994 | 159 000 000 $ US | 608 000 000 $ US |
| 1993 | 200 000 000 $ US | 678 000 000 $ US |
| 1992 | 200 000 000 $ US | 844 000 000 $ US |
| 1991 | - | 810 000 000 $ US |
| 1990 | - | 715 000 000 $ US |
| 1989 | - | 663 000 000 $ US |
| 1988 | - | 354 000 000 $ US |
| 1987 | - | 115 000 000 $ US |
| 1986 | - | 125 000 000 $ US |
| 1985 | - | 99 000 000 $ US |
| 1984 | - | 113 000 000 $ US |
| 1983 | - | 46 000 000 $ US |
| 1982 | - | 55 000 000 $ US |
| 1981 | - | 95 000 000 $ US |
| 1980 | - | 18 000 000 $ US |
| 1979 | - | 75 000 000 $ US |
| 1978 | - | 34 000 000 $ US |
| 1977 | - | 27 000 000 $ US |
| 1976 | - | 10 000 000 $ US |
| 1975 | - | 114 000 000 $ US |
| 1974 | - | 64 000 000 $ US |
| 1973 | - | 79 000 000 $ US |
| 1972 | - | 43 000 000 $ US |
| 1971 | - | 45 000 000 $ US |
| 1970 | - | 58 000 000 $ US |
En 2025, les entrées nettes d'investissements directs étrangers étaient de 1,62 milliard de dollars en Ukraine et de 13 milliards de dollars en Turquie : 8,0 fois plus en Turquie. En 1992, elles étaient de 200 millions de dollars en Ukraine et de 844 millions de dollars en Turquie.
Les entrées nettes d'investissements directs étrangers en Ukraine ont été inférieures à celles de la Turquie chacune des 34 années de 1992 à 2025.
Ukraine vs Turquie : dernières entrées et sorties d'investissements étrangers
|
Ukraine
|
Turquie
|
|
|---|---|---|
| Entrées nettes | +1,62 Md $US | +13,0 Md $US |
| Entrées nettes, % du PIB | +0,8 % | +0,8 % |
| Sorties nettes | −109 M $US | +9,83 Md $US |
| Entrées nettes, total 2016–2025 | +37,0 Md $US | +117 Md $US |
| Rang mondial | 79/192 | 31/192 |
Comparer les investissements directs étrangers de 2 pays au choix
Sources :
- Banque mondiale | Secteur financier (1970–2025, mis à jour en octobre 2026)
Creative Commons Attribution (CC BY) : vous pouvez copier, partager, adapter et réutiliser ce contenu, y compris à des fins commerciales, à condition de citer statistics.wiki et d’indiquer les modifications apportées. Les sources citées ci-dessus peuvent avoir leurs propres conditions de licence.