
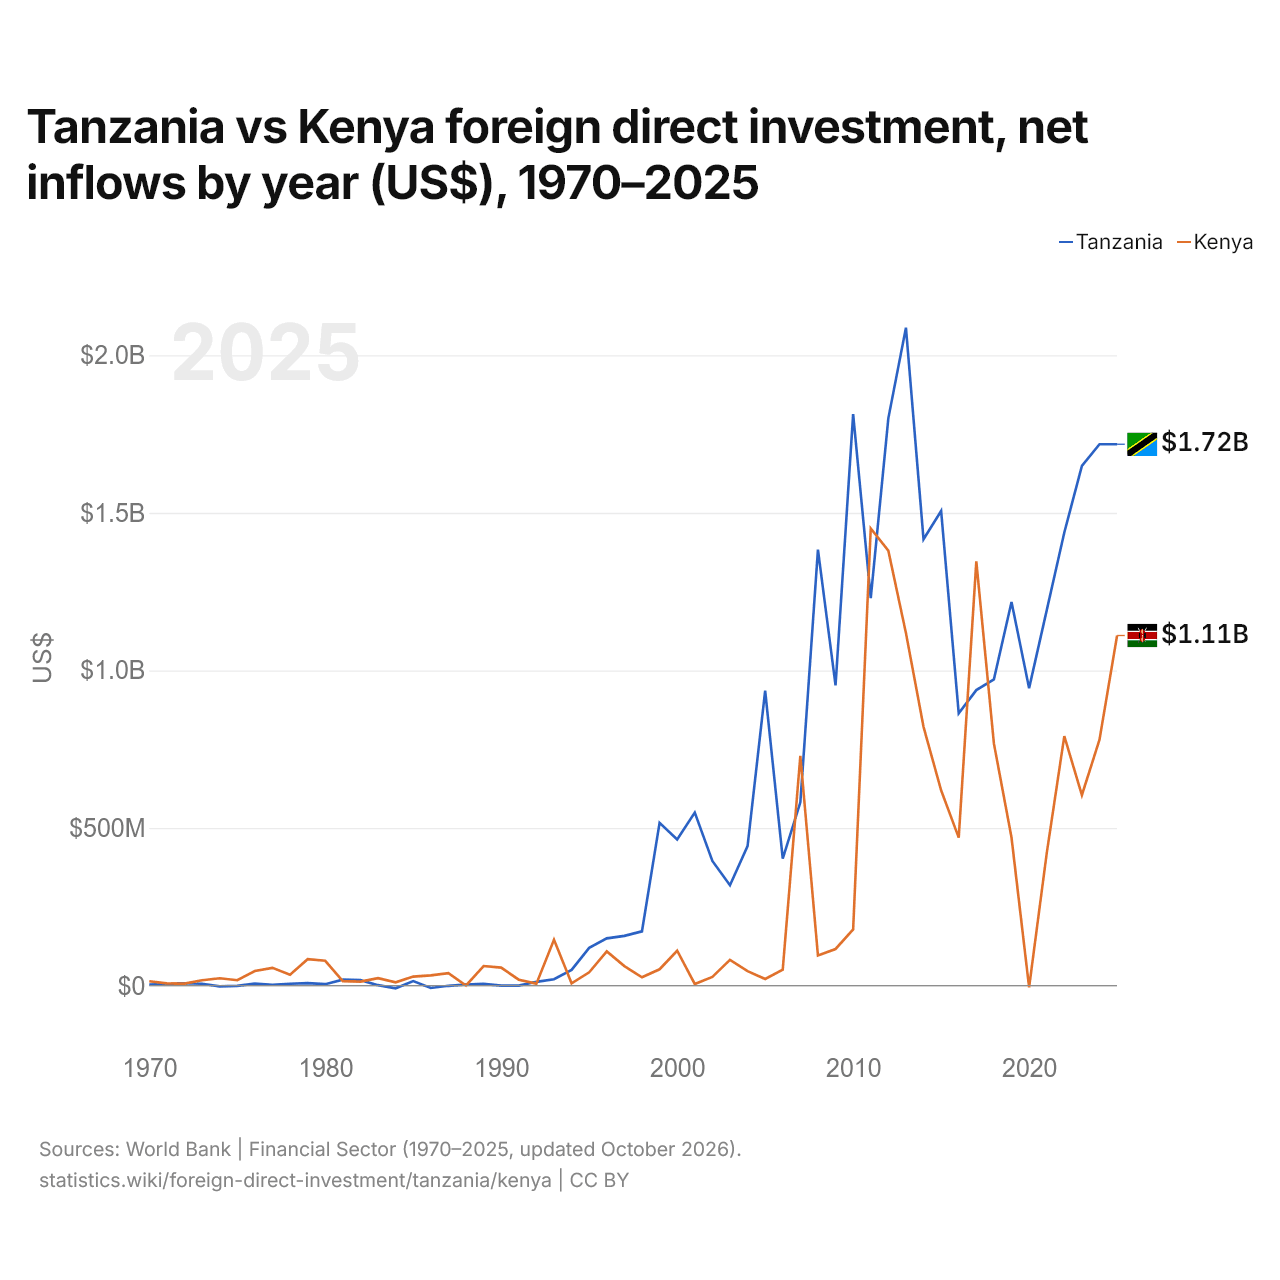
Tanzanie vs Kenya : investissements directs étrangers, entrées nettes par année ($ US), 1970–2025
| Année | $ US | |
|---|---|---|
 Tanzanie |
 Kenya |
|
| 2025 | 1 717 575 170 $ US | 1 110 789 689 $ US |
| 2024 | 1 717 575 169 $ US | 780 100 474 $ US |
| 2023 | 1 648 913 856 $ US | 604 719 207 $ US |
| 2022 | 1 437 575 169 $ US | 791 581 760 $ US |
| 2021 | 1 190 507 399 $ US | 419 719 613 $ US |
| 2020 | 943 765 262 $ US | −5 403 752 $ US |
| 2019 | 1 217 235 252 $ US | 469 940 267 $ US |
| 2018 | 971 576 866 $ US | 767 761 507 $ US |
| 2017 | 937 700 000 $ US | 1 346 085 345 $ US |
| 2016 | 864 040 000 $ US | 469 533 311 $ US |
| 2015 | 1 506 024 896 $ US | 619 724 465 $ US |
| 2014 | 1 416 088 065 $ US | 820 937 598 $ US |
| 2013 | 2 087 261 310 $ US | 1 118 825 000 $ US |
| 2012 | 1 799 646 137 $ US | 1 380 173 662 $ US |
| 2011 | 1 229 361 018 $ US | 1 450 474 757 $ US |
| 2010 | 1 813 200 000 $ US | 178 064 607 $ US |
| 2009 | 952 630 000 $ US | 116 257 609 $ US |
| 2008 | 1 383 260 000 $ US | 95 585 680 $ US |
| 2007 | 581 511 807 $ US | 729 044 146 $ US |
| 2006 | 403 038 991 $ US | 50 674 725 $ US |
| 2005 | 935 520 592 $ US | 21 211 685 $ US |
| 2004 | 442 539 548 $ US | 46 063 931 $ US |
| 2003 | 318 401 299 $ US | 81 738 243 $ US |
| 2002 | 395 567 134 $ US | 27 618 447 $ US |
| 2001 | 549 270 351 $ US | 5 302 623 $ US |
| 2000 | 463 400 859 $ US | 110 904 550 $ US |
| 1999 | 516 700 642 $ US | 51 953 456 $ US |
| 1998 | 172 306 245 $ US | 26 548 246 $ US |
| 1997 | 157 885 064 $ US | 62 096 810 $ US |
| 1996 | 150 066 382 $ US | 108 672 932 $ US |
| 1995 | 119 936 654 $ US | 42 289 248 $ US |
| 1994 | 50 000 895 $ US | 7 432 413 $ US |
| 1993 | 20 457 764 $ US | 145 655 517 $ US |
| 1992 | 12 169 639 $ US | 6 363 133 $ US |
| 1991 | 10 000 $ US | 18 830 977 $ US |
| 1990 | 10 000 $ US | 57 081 096 $ US |
| 1989 | 5 840 000 $ US | 62 189 917 $ US |
| 1988 | 3 760 000 $ US | 394 431 $ US |
| 1987 | −470 000 $ US | 39 381 344 $ US |
| 1986 | −7 490 000 $ US | 32 725 777 $ US |
| 1985 | 14 510 000 $ US | 28 845 949 $ US |
| 1984 | −8 420 000 $ US | 10 753 527 $ US |
| 1983 | 1 520 000 $ US | 23 738 843 $ US |
| 1982 | 17 310 000 $ US | 13 000 895 $ US |
| 1981 | 18 920 000 $ US | 14 147 557 $ US |
| 1980 | 4 580 000 $ US | 78 973 746 $ US |
| 1979 | 8 020 000 $ US | 84 009 903 $ US |
| 1978 | 6 120 000 $ US | 34 414 130 $ US |
| 1977 | 2 940 000 $ US | 56 545 226 $ US |
| 1976 | 6 560 000 $ US | 46 371 851 $ US |
| 1975 | −870 000 $ US | 17 158 747 $ US |
| 1974 | −2 060 000 $ US | 23 420 000 $ US |
| 1973 | 6 030 000 $ US | 17 260 000 $ US |
| 1972 | 7 690 000 $ US | 6 300 000 $ US |
| 1971 | 5 150 000 $ US | 7 400 000 $ US |
| 1970 | 3 070 000 $ US | 13 800 000 $ US |
En 2025, les entrées nettes d'investissements directs étrangers étaient de 1,72 milliard de dollars en Tanzanie et de 1,11 milliard de dollars au Kenya : 1,5 fois plus en Tanzanie. En 1970, elles étaient de 3,07 millions de dollars en Tanzanie et de 13,8 millions de dollars au Kenya.
Les entrées nettes d'investissements directs étrangers en Tanzanie ont été supérieures à celles du Kenya pendant 34 des 56 années de 1970 à 2025, et inférieures pendant 22.
Tanzanie vs Kenya : dernières entrées et sorties d'investissements étrangers
|
Tanzanie
|
Kenya
|
|
|---|---|---|
| Entrées nettes | +1,72 Md $US | +1,11 Md $US |
| Entrées nettes, % du PIB | +1,9 % | +0,8 % |
| Sorties nettes | n.d. | +430 M $US (2025) |
| Entrées nettes, total 2016–2025 | +12,6 Md $US | +6,75 Md $US |
| Rang mondial | 74/192 | 89/192 |
Comparer les investissements directs étrangers de 2 pays au choix
Sources :
- Banque mondiale | Secteur financier (1970–2025, mis à jour en octobre 2026)
Creative Commons Attribution (CC BY) : vous pouvez copier, partager, adapter et réutiliser ce contenu, y compris à des fins commerciales, à condition de citer statistics.wiki et d’indiquer les modifications apportées. Les sources citées ci-dessus peuvent avoir leurs propres conditions de licence.