
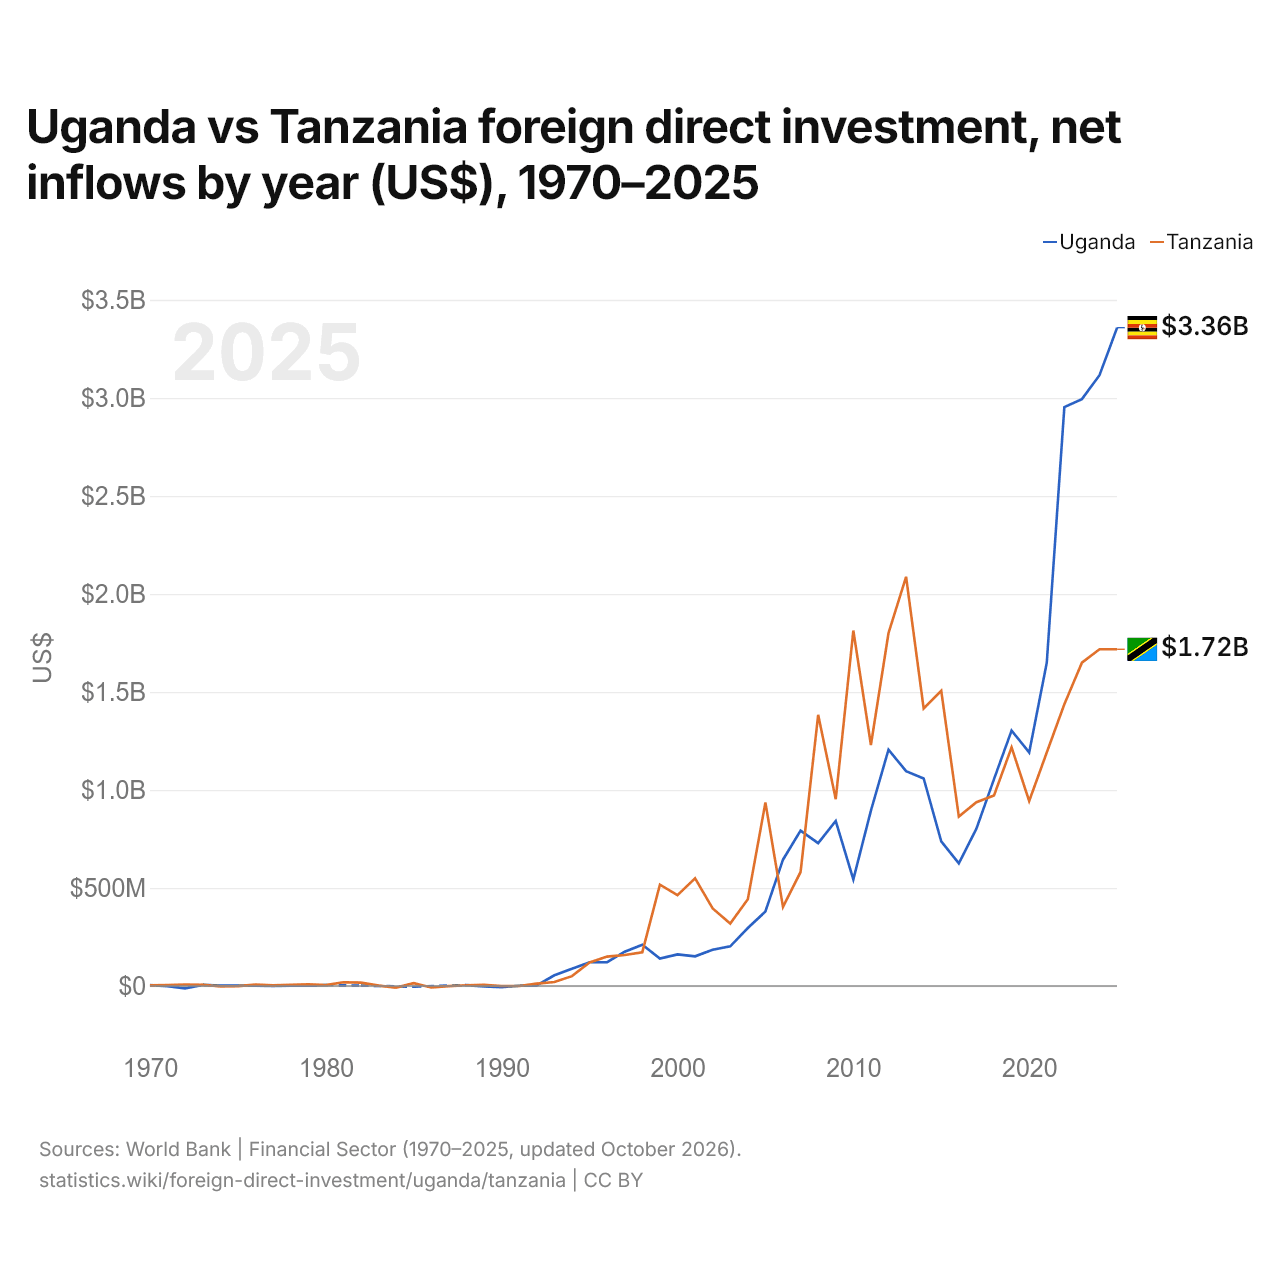
Ouganda vs Tanzanie : investissements directs étrangers, entrées nettes par année ($ US), 1970–2025
| Année | $ US | |
|---|---|---|
 Ouganda |
 Tanzanie |
|
| 2025 | 3 358 037 364 $ US | 1 717 575 170 $ US |
| 2024 | 3 115 669 894 $ US | 1 717 575 169 $ US |
| 2023 | 2 993 518 989 $ US | 1 648 913 856 $ US |
| 2022 | 2 952 941 688 $ US | 1 437 575 169 $ US |
| 2021 | 1 648 240 263 $ US | 1 190 507 399 $ US |
| 2020 | 1 191 485 424 $ US | 943 765 262 $ US |
| 2019 | 1 303 005 005 $ US | 1 217 235 252 $ US |
| 2018 | 1 055 353 353 $ US | 971 576 866 $ US |
| 2017 | 802 704 141 $ US | 937 700 000 $ US |
| 2016 | 625 704 362 $ US | 864 040 000 $ US |
| 2015 | 737 652 140 $ US | 1 506 024 896 $ US |
| 2014 | 1 058 564 540 $ US | 1 416 088 065 $ US |
| 2013 | 1 096 000 000 $ US | 2 087 261 310 $ US |
| 2012 | 1 205 388 488 $ US | 1 799 646 137 $ US |
| 2011 | 894 293 858 $ US | 1 229 361 018 $ US |
| 2010 | 543 872 727 $ US | 1 813 200 000 $ US |
| 2009 | 841 570 803 $ US | 952 630 000 $ US |
| 2008 | 728 860 901 $ US | 1 383 260 000 $ US |
| 2007 | 792 305 781 $ US | 581 511 807 $ US |
| 2006 | 644 262 500 $ US | 403 038 991 $ US |
| 2005 | 379 808 341 $ US | 935 520 592 $ US |
| 2004 | 295 416 480 $ US | 442 539 548 $ US |
| 2003 | 202 192 594 $ US | 318 401 299 $ US |
| 2002 | 184 648 059 $ US | 395 567 134 $ US |
| 2001 | 151 496 151 $ US | 549 270 351 $ US |
| 2000 | 160 700 000 $ US | 463 400 859 $ US |
| 1999 | 140 200 000 $ US | 516 700 642 $ US |
| 1998 | 210 000 000 $ US | 172 306 245 $ US |
| 1997 | 175 000 000 $ US | 157 885 064 $ US |
| 1996 | 121 000 000 $ US | 150 066 382 $ US |
| 1995 | 121 200 000 $ US | 119 936 654 $ US |
| 1994 | 88 200 000 $ US | 50 000 895 $ US |
| 1993 | 54 600 000 $ US | 20 457 764 $ US |
| 1992 | 3 000 000 $ US | 12 169 639 $ US |
| 1991 | 1 000 000 $ US | 10 000 $ US |
| 1990 | −5 910 000 $ US | 10 000 $ US |
| 1989 | −1 760 000 $ US | 5 840 000 $ US |
| 1988 | 4 700 000 $ US | 3 760 000 $ US |
| 1987 | - | −470 000 $ US |
| 1986 | - | −7 490 000 $ US |
| 1985 | −4 000 000 $ US | 14 510 000 $ US |
| 1984 | - | −8 420 000 $ US |
| 1983 | - | 1 520 000 $ US |
| 1982 | 2 020 000 $ US | 17 310 000 $ US |
| 1981 | - | 18 920 000 $ US |
| 1980 | 4 000 000 $ US | 4 580 000 $ US |
| 1979 | 2 000 000 $ US | 8 020 000 $ US |
| 1978 | 1 970 000 $ US | 6 120 000 $ US |
| 1977 | 800 000 $ US | 2 940 000 $ US |
| 1976 | 2 050 000 $ US | 6 560 000 $ US |
| 1975 | 2 100 000 $ US | −870 000 $ US |
| 1974 | 1 700 000 $ US | −2 060 000 $ US |
| 1973 | 5 200 000 $ US | 6 030 000 $ US |
| 1972 | −11 900 000 $ US | 7 690 000 $ US |
| 1971 | −1 200 000 $ US | 5 150 000 $ US |
| 1970 | 4 200 000 $ US | 3 070 000 $ US |
En 2025, les entrées nettes d'investissements directs étrangers étaient de 3,36 milliards de dollars en Ouganda et de 1,72 milliard de dollars en Tanzanie : 2,0 fois plus en Ouganda. En 1970, elles étaient de 4,2 millions de dollars en Ouganda et de 3,07 millions de dollars en Tanzanie.
Les entrées nettes d'investissements directs étrangers en Ouganda ont été supérieures à celles de la Tanzanie pendant 20 des 51 années de 1970 à 2025 que les deux pays ont communiquées, et inférieures pendant 31.
Ouganda vs Tanzanie : dernières entrées et sorties d'investissements étrangers
|
Ouganda
|
Tanzanie
|
|
|---|---|---|
| Entrées nettes | +3,36 Md $US | +1,72 Md $US |
| Entrées nettes, % du PIB | +5,4 % | +1,9 % |
| Sorties nettes | +417 k $US (2025) | n.d. |
| Entrées nettes, total 2016–2025 | +19,0 Md $US | +12,6 Md $US |
| Rang mondial | 55/192 | 74/192 |
Comparer les investissements directs étrangers de 2 pays au choix
Sources :
- Banque mondiale | Secteur financier (1970–2025, mis à jour en octobre 2026)
Creative Commons Attribution (CC BY) : vous pouvez copier, partager, adapter et réutiliser ce contenu, y compris à des fins commerciales, à condition de citer statistics.wiki et d’indiquer les modifications apportées. Les sources citées ci-dessus peuvent avoir leurs propres conditions de licence.