
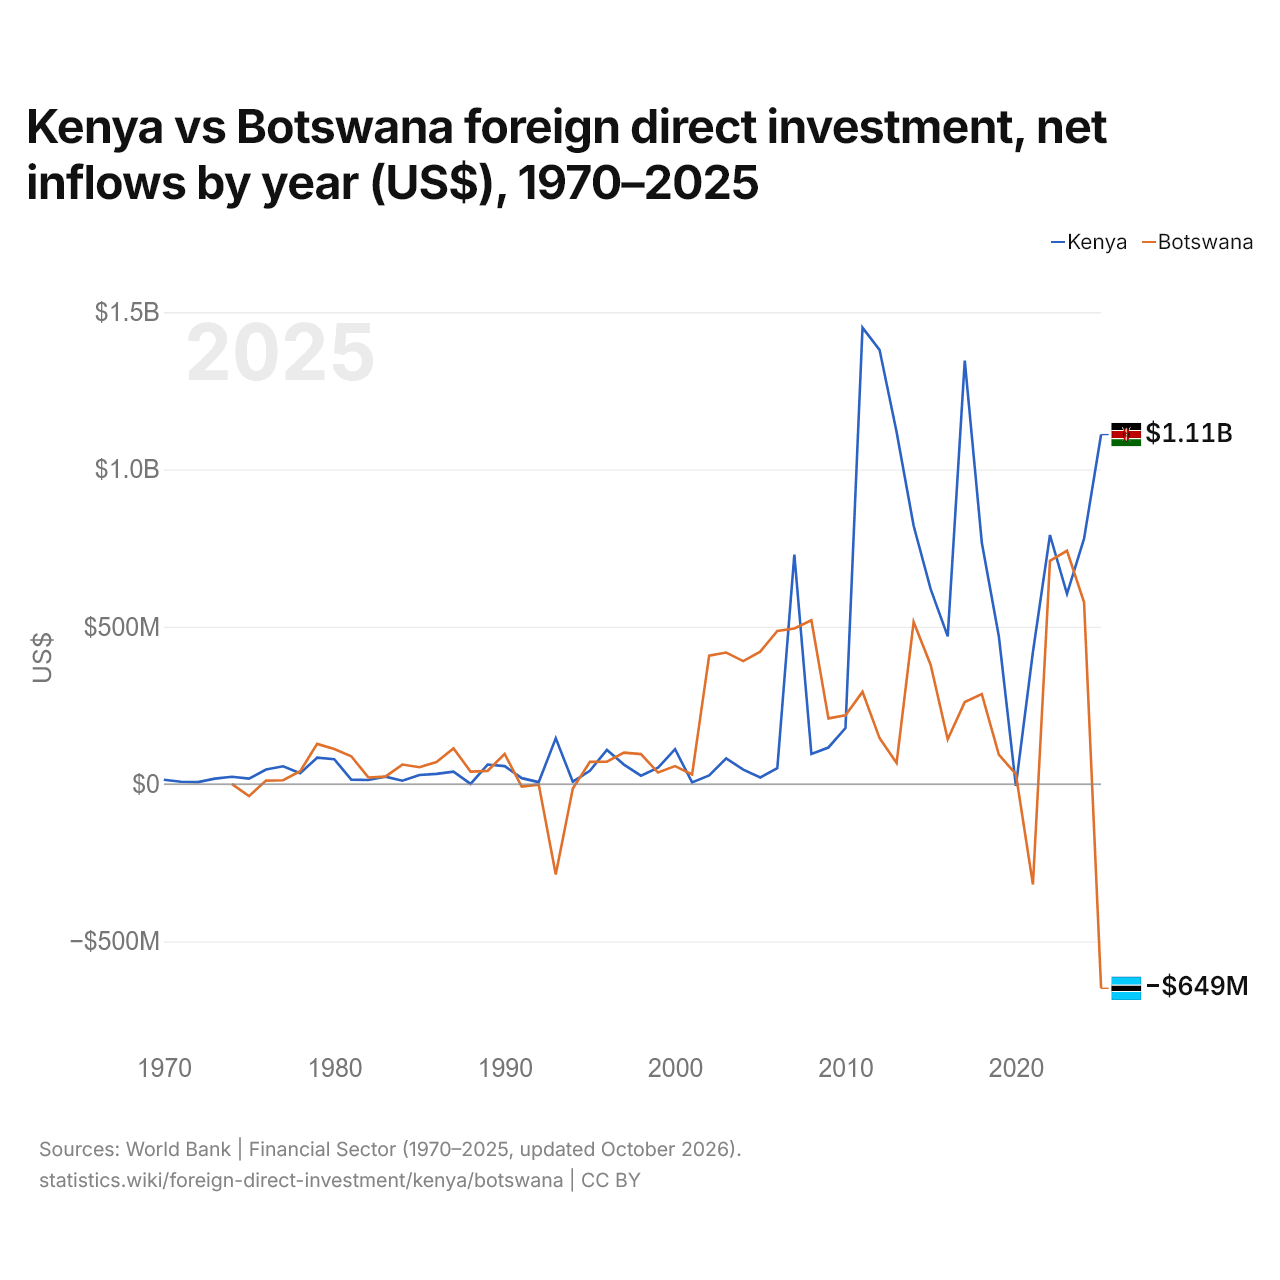
Kenya vs Botswana : investissements directs étrangers, entrées nettes par année ($ US), 1970–2025
| Année | $ US | |
|---|---|---|
 Kenya |
 Botswana |
|
| 2025 | 1 110 789 689 $ US | −648 995 319 $ US |
| 2024 | 780 100 474 $ US | 577 945 337 $ US |
| 2023 | 604 719 207 $ US | 741 532 368 $ US |
| 2022 | 791 581 760 $ US | 709 624 140 $ US |
| 2021 | 419 719 613 $ US | −319 055 858 $ US |
| 2020 | −5 403 752 $ US | 31 792 610 $ US |
| 2019 | 469 940 267 $ US | 93 607 130 $ US |
| 2018 | 767 761 507 $ US | 285 955 062 $ US |
| 2017 | 1 346 085 345 $ US | 260 575 129 $ US |
| 2016 | 469 533 311 $ US | 142 522 598 $ US |
| 2015 | 619 724 465 $ US | 378 554 182 $ US |
| 2014 | 820 937 598 $ US | 515 184 471 $ US |
| 2013 | 1 118 825 000 $ US | 67 136 806 $ US |
| 2012 | 1 380 173 662 $ US | 146 084 155 $ US |
| 2011 | 1 450 474 757 $ US | 293 208 060 $ US |
| 2010 | 178 064 607 $ US | 218 379 838 $ US |
| 2009 | 116 257 609 $ US | 208 699 298 $ US |
| 2008 | 95 585 680 $ US | 520 917 902 $ US |
| 2007 | 729 044 146 $ US | 494 634 226 $ US |
| 2006 | 50 674 725 $ US | 486 913 109 $ US |
| 2005 | 21 211 685 $ US | 420 854 175 $ US |
| 2004 | 46 063 931 $ US | 390 889 252 $ US |
| 2003 | 81 738 243 $ US | 418 040 676 $ US |
| 2002 | 27 618 447 $ US | 407 997 392 $ US |
| 2001 | 5 302 623 $ US | 30 680 571 $ US |
| 2000 | 110 904 550 $ US | 57 171 341 $ US |
| 1999 | 51 953 456 $ US | 36 675 066 $ US |
| 1998 | 26 548 246 $ US | 95 318 135 $ US |
| 1997 | 62 096 810 $ US | 100 109 749 $ US |
| 1996 | 108 672 932 $ US | 71 182 311 $ US |
| 1995 | 42 289 248 $ US | 70 413 221 $ US |
| 1994 | 7 432 413 $ US | −14 154 569 $ US |
| 1993 | 145 655 517 $ US | −286 949 434 $ US |
| 1992 | 6 363 133 $ US | −1 564 185 $ US |
| 1991 | 18 830 977 $ US | −8 211 494 $ US |
| 1990 | 57 081 096 $ US | 95 889 963 $ US |
| 1989 | 62 189 917 $ US | 42 186 013 $ US |
| 1988 | 394 431 $ US | 39 921 524 $ US |
| 1987 | 39 381 344 $ US | 113 583 514 $ US |
| 1986 | 32 725 777 $ US | 70 404 391 $ US |
| 1985 | 28 845 949 $ US | 53 611 788 $ US |
| 1984 | 10 753 527 $ US | 62 154 696 $ US |
| 1983 | 23 738 843 $ US | 23 793 769 $ US |
| 1982 | 13 000 895 $ US | 21 074 901 $ US |
| 1981 | 14 147 557 $ US | 88 438 640 $ US |
| 1980 | 78 973 746 $ US | 111 550 709 $ US |
| 1979 | 84 009 903 $ US | 127 851 715 $ US |
| 1978 | 34 414 130 $ US | 40 813 517 $ US |
| 1977 | 56 545 226 $ US | 12 233 365 $ US |
| 1976 | 46 371 851 $ US | 11 270 003 $ US |
| 1975 | 17 158 747 $ US | −38 268 702 $ US |
| 1974 | 23 420 000 $ US | 70 000 $ US |
| 1973 | 17 260 000 $ US | - |
| 1972 | 6 300 000 $ US | - |
| 1971 | 7 400 000 $ US | - |
| 1970 | 13 800 000 $ US | - |
En 2025, les entrées nettes d'investissements directs étrangers étaient de 1,11 milliard de dollars au Kenya et négatives au Botswana, 649 millions de dollars. En 1974, elles étaient de 23,4 millions de dollars au Kenya et de 70 000 dollars au Botswana.
Les entrées nettes d'investissements directs étrangers au Kenya ont été supérieures à celles du Botswana pendant 26 des 52 années de 1974 à 2025, et inférieures pendant 26.
Kenya vs Botswana : dernières entrées et sorties d'investissements étrangers
|
Kenya
|
Botswana
|
|
|---|---|---|
| Entrées nettes | +1,11 Md $US | −649 M $US |
| Entrées nettes, % du PIB | +0,8 % | −3,3 % |
| Sorties nettes | +430 M $US | +124 M $US |
| Entrées nettes, total 2016–2025 | +6,75 Md $US | +1,88 Md $US |
| Rang mondial | 89/192 | 180/192 |
Comparer les investissements directs étrangers de 2 pays au choix
Sources :
- Banque mondiale | Secteur financier (1970–2025, mis à jour en octobre 2026)
Creative Commons Attribution (CC BY) : vous pouvez copier, partager, adapter et réutiliser ce contenu, y compris à des fins commerciales, à condition de citer statistics.wiki et d’indiquer les modifications apportées. Les sources citées ci-dessus peuvent avoir leurs propres conditions de licence.