
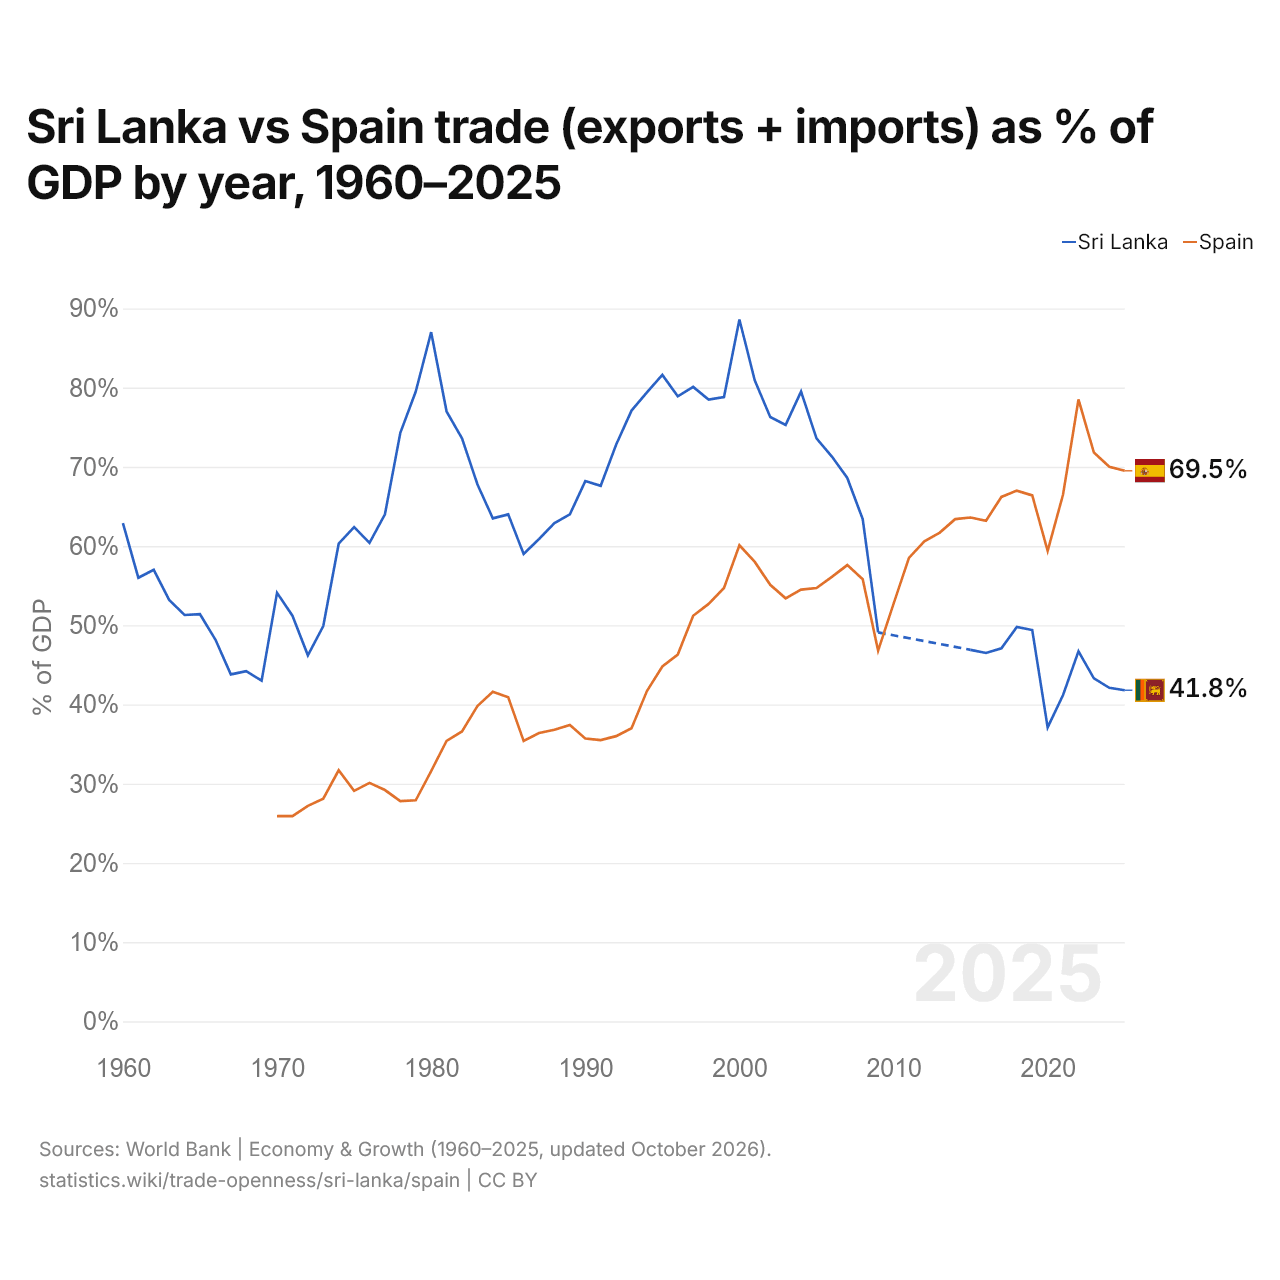
Sri Lanka vs España: comercio (exportaciones + importaciones) en % del PIB por año, 1960–2025
1x
| Año | % del PIB | |
|---|---|---|
 Sri Lanka |
 España |
|
| 2025 | 41,8 % | 69,5 % |
| 2024 | 42,1 % | 70 % |
| 2023 | 43,3 % | 71,8 % |
| 2022 | 46,7 % | 78,5 % |
| 2021 | 41,2 % | 66,5 % |
| 2020 | 37,1 % | 59,4 % |
| 2019 | 49,4 % | 66,4 % |
| 2018 | 49,8 % | 67 % |
| 2017 | 47,1 % | 66,2 % |
| 2016 | 46,5 % | 63,2 % |
| 2015 | 46,9 % | 63,6 % |
| 2014 | - | 63,4 % |
| 2013 | - | 61,7 % |
| 2012 | - | 60,6 % |
| 2011 | - | 58,5 % |
| 2010 | - | 52,7 % |
| 2009 | 49,1 % | 46,8 % |
| 2008 | 63,4 % | 55,8 % |
| 2007 | 68,6 % | 57,6 % |
| 2006 | 71,3 % | 56,1 % |
| 2005 | 73,6 % | 54,7 % |
| 2004 | 79,5 % | 54,5 % |
| 2003 | 75,3 % | 53,4 % |
| 2002 | 76,3 % | 55,1 % |
| 2001 | 80,9 % | 58 % |
| 2000 | 88,6 % | 60,1 % |
| 1999 | 78,8 % | 54,7 % |
| 1998 | 78,5 % | 52,7 % |
| 1997 | 80,1 % | 51,2 % |
| 1996 | 78,9 % | 46,3 % |
| 1995 | 81,6 % | 44,8 % |
| 1994 | 79,4 % | 41,7 % |
| 1993 | 77,1 % | 37 % |
| 1992 | 72,8 % | 36 % |
| 1991 | 67,6 % | 35,5 % |
| 1990 | 68,2 % | 35,7 % |
| 1989 | 64 % | 37,4 % |
| 1988 | 62,9 % | 36,8 % |
| 1987 | 60,9 % | 36,4 % |
| 1986 | 59 % | 35,4 % |
| 1985 | 64 % | 40,9 % |
| 1984 | 63,5 % | 41,6 % |
| 1983 | 67,8 % | 39,8 % |
| 1982 | 73,6 % | 36,6 % |
| 1981 | 77 % | 35,4 % |
| 1980 | 87 % | 31,6 % |
| 1979 | 79,5 % | 27,9 % |
| 1978 | 74,3 % | 27,8 % |
| 1977 | 64 % | 29,2 % |
| 1976 | 60,4 % | 30,1 % |
| 1975 | 62,4 % | 29,1 % |
| 1974 | 60,3 % | 31,7 % |
| 1973 | 49,9 % | 28,1 % |
| 1972 | 46,2 % | 27,2 % |
| 1971 | 51,2 % | 25,9 % |
| 1970 | 54,1 % | 25,9 % |
| 1969 | 43 % | - |
| 1968 | 44,2 % | - |
| 1967 | 43,8 % | - |
| 1966 | 48,2 % | - |
| 1965 | 51,4 % | - |
| 1964 | 51,3 % | - |
| 1963 | 53,2 % | - |
| 1962 | 57 % | - |
| 1961 | 56 % | - |
| 1960 | 62,9 % | - |
En 2025, el comercio equivalió al 41,8 % del PIB en Sri Lanka y al 69,5 % en España: 27,7 puntos porcentuales más en España. En 2015, los porcentajes eran del 46,9 % en Sri Lanka y del 63,6 % en España, 16,7 puntos porcentuales más en España.
La diferencia fue máxima en 1980, cuando el comercio de Sri Lanka superó al de España en 55,4 puntos porcentuales del PIB.
Sri Lanka vs España: últimas exportaciones e importaciones en % del PIB
|
Sri Lanka
|
España
|
|
|---|---|---|
| Comercio | 41,8 % (2025) | 69,5 % (2025) |
| Exportaciones | 19,0 % | 36,6 % |
| Importaciones | 22,8 % | 32,8 % |
| Puesto mundial | 148/174 | 106/174 |
Comparar la apertura comercial de 2 países cualesquiera
Fuentes:
- Banco Mundial | Economía y crecimiento (1960–2025, actualizado en octubre de 2026)
Creative Commons Atribución (CC BY): puedes copiar, compartir, adaptar y reutilizar este contenido, también con fines comerciales, siempre que cites a statistics.wiki e indiques los cambios que hayas hecho. Las fuentes indicadas arriba pueden tener sus propias condiciones de licencia.