
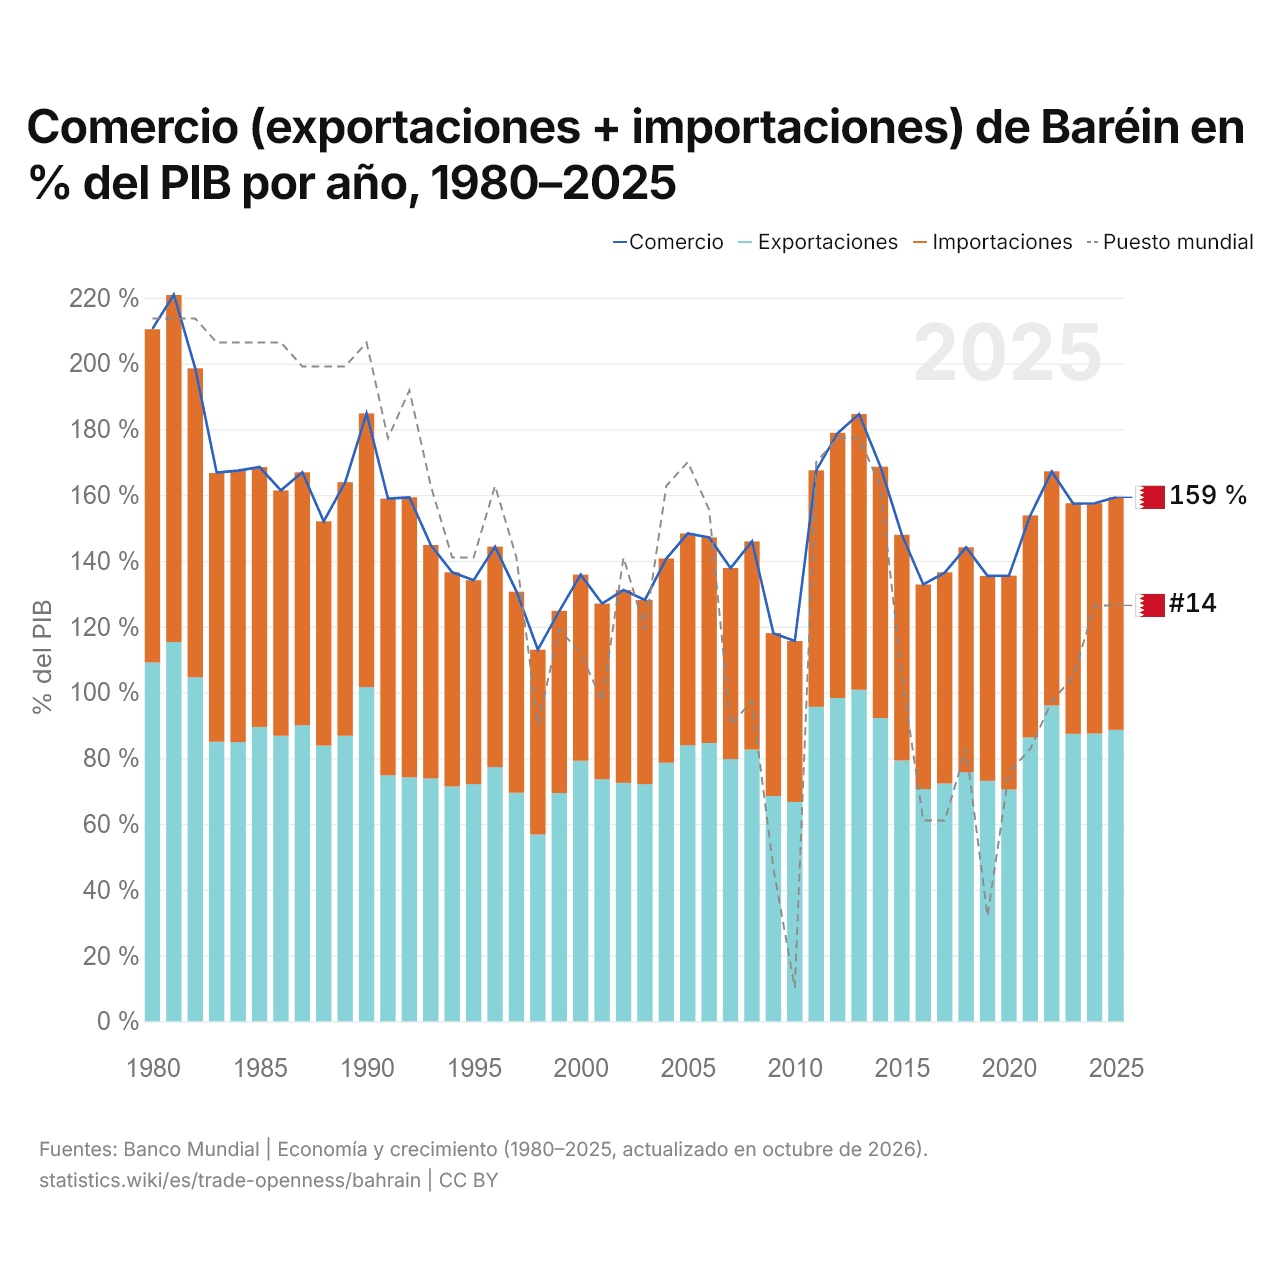
Comercio (exportaciones + importaciones) de Baréin en % del PIB por año, 1980–2025
| Año | % del PIB | Puesto mundial | ||
|---|---|---|---|---|
| Exportaciones | Importaciones | Comercio | Puesto mundial | |
| 2025 | 88,6 % | 70,7 % | 159,3 % | #14 |
| 2024 | 87,5 % | 70 % | 157,5 % | #14 |
| 2023 | 87,4 % | 70,1 % | 157,4 % | #17 |
| 2022 | 96 % | 71,2 % | 167,1 % | #18 |
| 2021 | 86,3 % | 67,5 % | 153,8 % | #20 |
| 2020 | 70,5 % | 65 % | 135,5 % | #21 |
| 2019 | 73,1 % | 62,3 % | 135,4 % | #27 |
| 2018 | 75,7 % | 68,4 % | 144,1 % | #20 |
| 2017 | 72,3 % | 64,2 % | 136,4 % | #23 |
| 2016 | 70,6 % | 62,2 % | 132,8 % | #23 |
| 2015 | 79,3 % | 68,6 % | 147,9 % | #17 |
| 2014 | 92,2 % | 76,4 % | 168,6 % | #9 |
| 2013 | 100,8 % | 83,8 % | 184,6 % | #7 |
| 2012 | 98,3 % | 80,6 % | 178,8 % | #7 |
| 2011 | 95,6 % | 71,9 % | 167,5 % | #8 |
| 2010 | 66,7 % | 48,9 % | 115,6 % | #30 |
| 2009 | 68,5 % | 49,5 % | 118 % | #25 |
| 2008 | 82,6 % | 63,3 % | 145,9 % | #18 |
| 2007 | 79,7 % | 58,1 % | 137,8 % | #19 |
| 2006 | 84,6 % | 62,5 % | 147,1 % | #10 |
| 2005 | 83,9 % | 64,4 % | 148,3 % | #8 |
| 2004 | 78,6 % | 62,1 % | 140,7 % | #9 |
| 2003 | 72,1 % | 56 % | 128,1 % | #15 |
| 2002 | 72,5 % | 58,6 % | 131,1 % | #12 |
| 2001 | 73,6 % | 53,4 % | 127 % | #18 |
| 2000 | 79,2 % | 56,6 % | 135,8 % | #16 |
| 1999 | 69,4 % | 55,4 % | 124,7 % | #15 |
| 1998 | 56,8 % | 56,2 % | 113 % | #19 |
| 1997 | 69,5 % | 61,1 % | 130,7 % | #12 |
| 1996 | 77,3 % | 67 % | 144,3 % | #9 |
| 1995 | 72,1 % | 62 % | 134,1 % | #12 |
| 1994 | 71,4 % | 65,1 % | 136,5 % | #12 |
| 1993 | 73,8 % | 71 % | 144,8 % | #9 |
| 1992 | 74,2 % | 85,1 % | 159,3 % | #5 |
| 1991 | 74,8 % | 84,1 % | 158,9 % | #7 |
| 1990 | 101,6 % | 83,2 % | 184,8 % | #3 |
| 1989 | 86,8 % | 77,1 % | 163,8 % | #4 |
| 1988 | 83,8 % | 68,2 % | 152 % | #4 |
| 1987 | 90 % | 76,9 % | 166,9 % | #4 |
| 1986 | 86,8 % | 74,6 % | 161,4 % | #3 |
| 1985 | 89,5 % | 79 % | 168,5 % | #3 |
| 1984 | 84,9 % | 82,5 % | 167,4 % | #3 |
| 1983 | 85 % | 81,7 % | 166,8 % | #3 |
| 1982 | 104,6 % | 93,9 % | 198,5 % | #2 |
| 1981 | 115,3 % | 105,5 % | 220,9 % | #2 |
| 1980 | 109,1 % | 101,3 % | 210,5 % | #2 |
En 2025, el comercio de Baréin equivalió al 159,3 % de su PIB, frente al 210,5 % en 1980. Su máximo fue del 220,9 %, en 1981. Las exportaciones representaron el 88,6 % del PIB y las importaciones, el 70,7 %. Ocupó el puesto 14 del mundo, puesto que mantiene desde 2024. Su mejor posición fue el puesto 2, por última vez en 1982.
En 2025, el comercio de Baréin, como porcentaje del PIB, fue el 4.º más alto de 44 países de Asia, donde iba desde 27,2 % en Pakistán hasta 320,3 % en Singapur.
Baréin en la clasificación mundial del comercio en % del PIB, 2025
| Puesto | País | Comercio | Exportaciones | Importaciones | |
|---|---|---|---|---|---|
| 11 |
 Seychelles |
172,3 % | 79,6 % | 92,7 % | |
| 12 |
 Eslovaquia |
170,3 % | 85,1 % | 85,2 % | |
| 13 |
 Nauru |
165,4 % | 61,8 % | 103,7 % | |
| 14 |
 Baréin |
159,3 % | 88,6 % | 70,7 % | |
| 15 |
 Maldivas |
156,5 % (2024) | 78,2 % | 78,3 % | |
| 16 |
 Estonia |
155,8 % | 78,4 % | 77,4 % | |
| 17 |
 Lesoto |
154,0 % | 49,5 % | 104,5 % |
Comparar la apertura comercial de Baréin con otros países
Fuentes:
- Banco Mundial | Economía y crecimiento (1980–2025, actualizado en octubre de 2026)
Creative Commons Atribución (CC BY): puedes copiar, compartir, adaptar y reutilizar este contenido, también con fines comerciales, siempre que cites a statistics.wiki e indiques los cambios que hayas hecho. Las fuentes indicadas arriba pueden tener sus propias condiciones de licencia.