
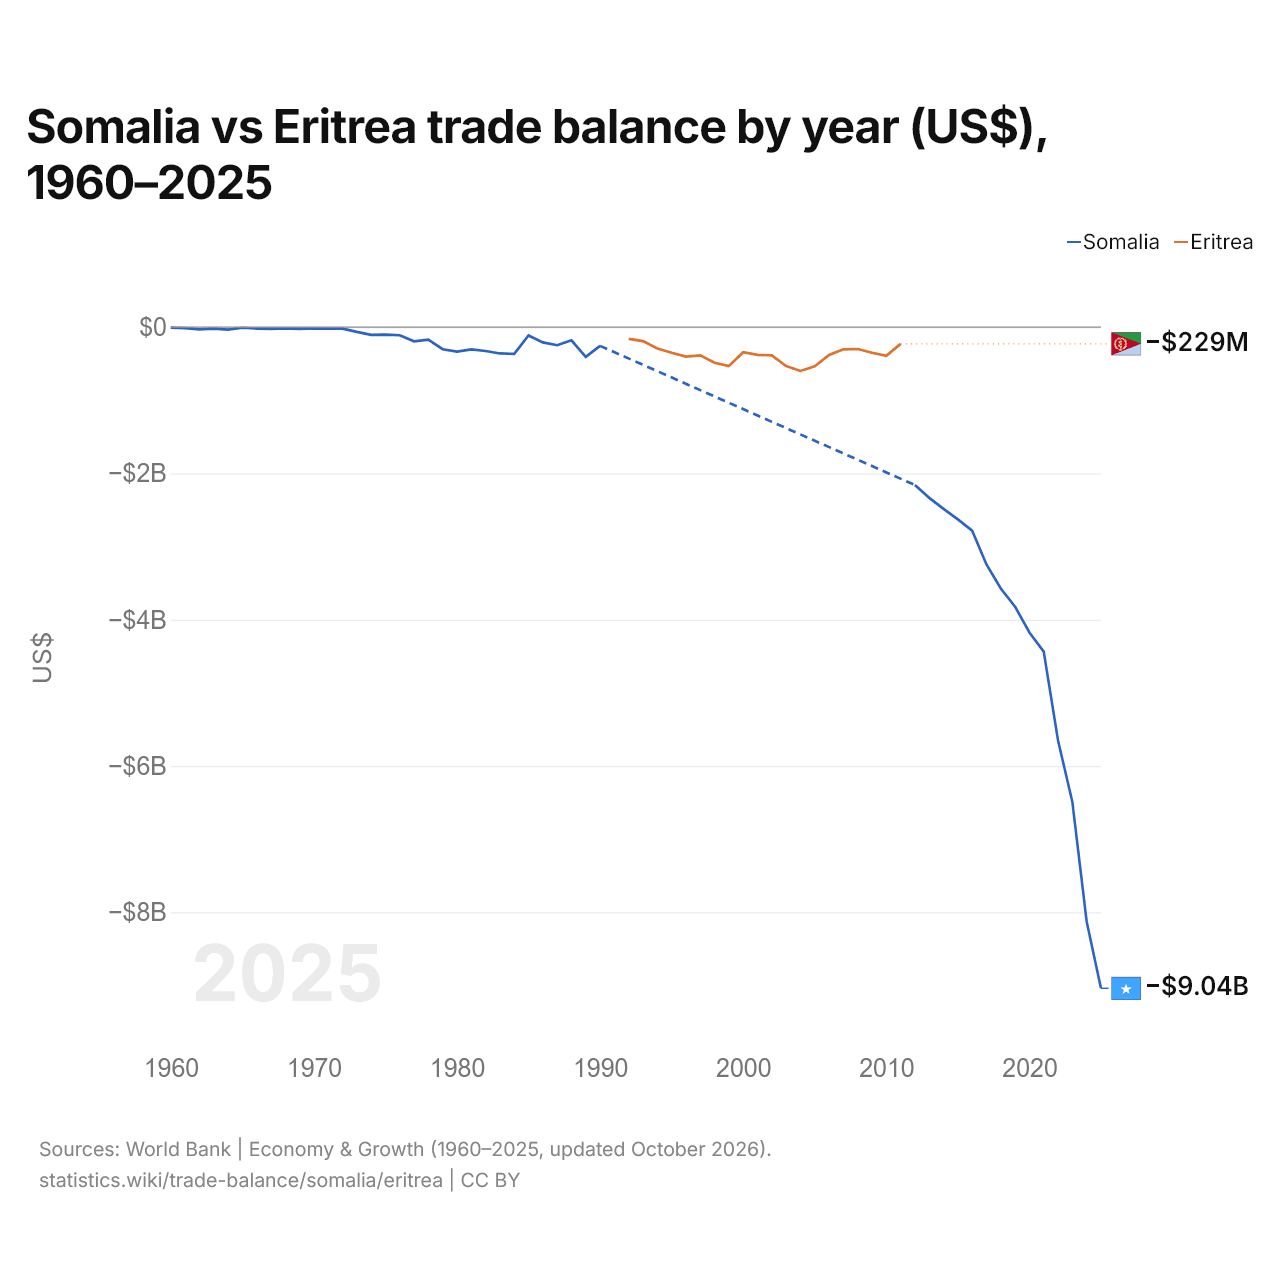
Somalia vs Eritrea: balanza comercial por año (US$), 1960–2025
1x
| Año | US$ | |
|---|---|---|
 Somalia |
 Eritrea |
|
| 2025 | −9.040.300.001 US$ | - |
| 2024 | −8.126.000.000 US$ | - |
| 2023 | −6.492.000.000 US$ | - |
| 2022 | −5.652.000.000 US$ | - |
| 2021 | −4.437.000.000 US$ | - |
| 2020 | −4.175.000.000 US$ | - |
| 2019 | −3.823.000.000 US$ | - |
| 2018 | −3.574.000.000 US$ | - |
| 2017 | −3.245.437.170 US$ | - |
| 2016 | −2.783.701.090 US$ | - |
| 2015 | −2.629.194.410 US$ | - |
| 2014 | −2.484.707.930 US$ | - |
| 2013 | −2.334.254.790 US$ | - |
| 2012 | −2.159.151.960 US$ | - |
| 2011 | - | −228.887.167 US$ |
| 2010 | - | −392.844.169 US$ |
| 2009 | - | −351.191.993 US$ |
| 2008 | - | −299.548.403 US$ |
| 2007 | - | −303.343.089 US$ |
| 2006 | - | −381.053.659 US$ |
| 2005 | - | −535.752.295 US$ |
| 2004 | - | −599.112.181 US$ |
| 2003 | - | −531.923.316 US$ |
| 2002 | - | −386.743.256 US$ |
| 2001 | - | −379.561.211 US$ |
| 2000 | - | −342.873.247 US$ |
| 1999 | - | −531.779.120 US$ |
| 1998 | - | −486.517.938 US$ |
| 1997 | - | −385.705.357 US$ |
| 1996 | - | −403.291.016 US$ |
| 1995 | - | −349.968.750 US$ |
| 1994 | - | −291.590.909 US$ |
| 1993 | - | −191.578.062 US$ |
| 1992 | - | −159.972.073 US$ |
| 1991 | - | - |
| 1990 | −256.356.574 US$ | - |
| 1989 | −406.520.818 US$ | - |
| 1988 | −180.270.963 US$ | - |
| 1987 | −247.643.145 US$ | - |
| 1986 | −208.682.717 US$ | - |
| 1985 | −113.728.919 US$ | - |
| 1984 | −366.490.400 US$ | - |
| 1983 | −360.031.823 US$ | - |
| 1982 | −325.891.971 US$ | - |
| 1981 | −304.470.475 US$ | - |
| 1980 | −333.831.294 US$ | - |
| 1979 | −302.427.801 US$ | - |
| 1978 | −170.994.343 US$ | - |
| 1977 | −194.202.889 US$ | - |
| 1976 | −111.485.331 US$ | - |
| 1975 | −102.494.073 US$ | - |
| 1974 | −105.321.658 US$ | - |
| 1973 | −65.748.612 US$ | - |
| 1972 | −20.056.952 US$ | - |
| 1971 | −22.024.117 US$ | - |
| 1970 | −16.857.157 US$ | - |
| 1969 | −23.471.429 US$ | - |
| 1968 | −18.997.992 US$ | - |
| 1967 | −23.379.991 US$ | - |
| 1966 | −19.599.992 US$ | - |
| 1965 | −8.497.983 US$ | - |
| 1964 | −33.180.009 US$ | - |
| 1963 | −21.840.005 US$ | - |
| 1962 | −29.959.995 US$ | - |
| 1961 | −13.580.012 US$ | - |
| 1960 | −7.994.015 US$ | - |
La balanza comercial de Somalia tiene un déficit de 9,04 mil millones de US$ (2025), y la de Eritrea, un déficit de 229 millones de US$ (2011).
Somalia vs Eritrea: cifras de la balanza comercial
|
Somalia
|
Eritrea
|
|
|---|---|---|
| Bienes y servicios, US$ | −9040 M US$ (2025) | −229 M US$ (2011) |
| % del PIB | −69,6 % (2025) | −11,1 % (2011) |
| Años con superávit desde 2000 | 0 de 14 | 0 de 12 |
| Saldo de bienes entre ambos, cifras propias | n/d | n/d |
| Mayor superávit en bienes con | Arabia Saudí (+306 M US$, 2025) | n/d |
| Mayor déficit en bienes con | China (−1020 M US$, 2025) | n/d |
Comparar la balanza comercial de 2 países cualesquiera
Fuentes:
- Banco Mundial | Economía y crecimiento (1960–2025, actualizado en octubre de 2026)
- TradeMap (2025, actualizado en octubre de 2026)
Creative Commons Atribución (CC BY): puedes copiar, compartir, adaptar y reutilizar este contenido, también con fines comerciales, siempre que cites a statistics.wiki e indiques los cambios que hayas hecho. Las fuentes indicadas arriba pueden tener sus propias condiciones de licencia.