
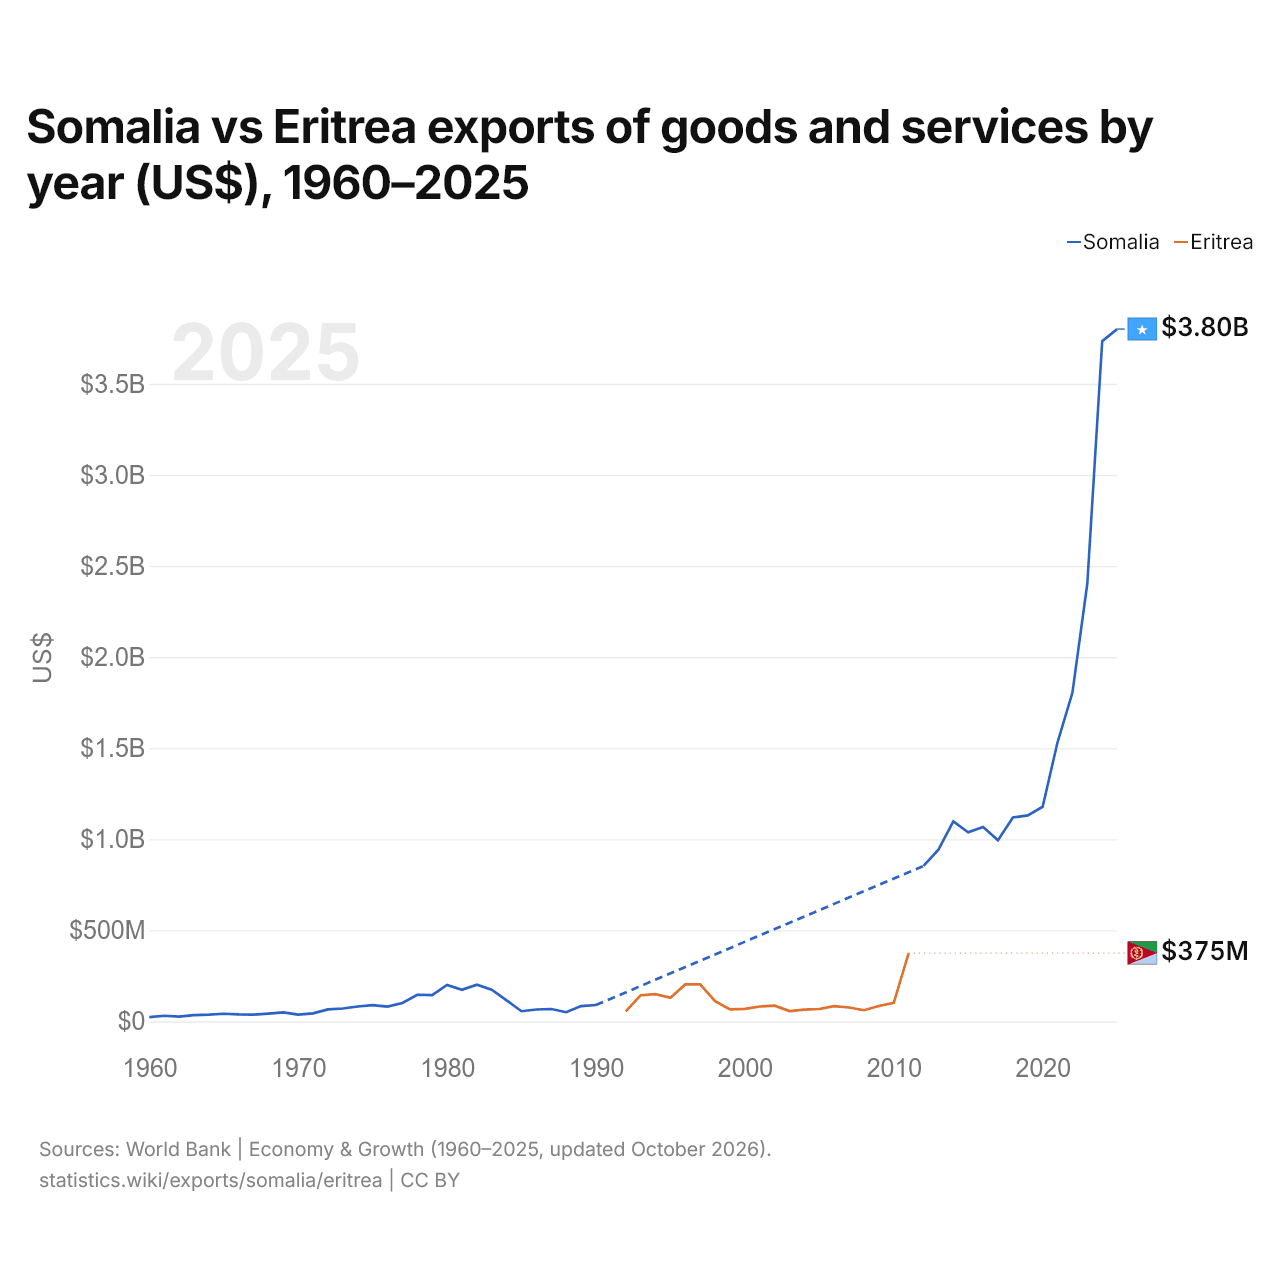
Somalia vs Eritrea: exportaciones de bienes y servicios por año (US$), 1960–2025
1x
| Año | US$ | |
|---|---|---|
 Somalia |
 Eritrea |
|
| 2025 | 3.800.900.000 US$ | - |
| 2024 | 3.735.000.000 US$ | - |
| 2023 | 2.404.000.000 US$ | - |
| 2022 | 1.804.000.000 US$ | - |
| 2021 | 1.532.000.000 US$ | - |
| 2020 | 1.178.000.000 US$ | - |
| 2019 | 1.131.000.000 US$ | - |
| 2018 | 1.119.000.000 US$ | - |
| 2017 | 994.339.300 US$ | - |
| 2016 | 1.067.190.800 US$ | - |
| 2015 | 1.037.964.070 US$ | - |
| 2014 | 1.097.727.150 US$ | - |
| 2013 | 942.600.660 US$ | - |
| 2012 | 853.397.770 US$ | - |
| 2011 | - | 374.897.685 US$ |
| 2010 | - | 101.385.281 US$ |
| 2009 | - | 84.082.758 US$ |
| 2008 | - | 61.125.203 US$ |
| 2007 | - | 76.071.545 US$ |
| 2006 | - | 83.564.228 US$ |
| 2005 | - | 67.725.717 US$ |
| 2004 | - | 64.052.294 US$ |
| 2003 | - | 56.064.246 US$ |
| 2002 | - | 85.922.706 US$ |
| 2001 | - | 81.309.112 US$ |
| 2000 | - | 68.310.442 US$ |
| 1999 | - | 65.684.301 US$ |
| 1998 | - | 110.594.504 US$ |
| 1997 | - | 203.302.824 US$ |
| 1996 | - | 202.746.708 US$ |
| 1995 | - | 129.406.250 US$ |
| 1994 | - | 148.977.273 US$ |
| 1993 | - | 142.966.419 US$ |
| 1992 | - | 54.502.215 US$ |
| 1991 | - | - |
| 1990 | 89.748.800 US$ | - |
| 1989 | 83.929.436 US$ | - |
| 1988 | 50.072.046 US$ | - |
| 1987 | 67.562.031 US$ | - |
| 1986 | 64.782.761 US$ | - |
| 1985 | 55.477.537 US$ | - |
| 1984 | 115.004.197 US$ | - |
| 1983 | 173.400.620 US$ | - |
| 1982 | 201.101.593 US$ | - |
| 1981 | 173.525.712 US$ | - |
| 1980 | 200.271.074 US$ | - |
| 1979 | 143.504.008 US$ | - |
| 1978 | 145.994.475 US$ | - |
| 1977 | 101.014.493 US$ | - |
| 1976 | 81.000.764 US$ | - |
| 1975 | 88.594.087 US$ | - |
| 1974 | 81.652.120 US$ | - |
| 1973 | 70.524.572 US$ | - |
| 1972 | 65.614.885 US$ | - |
| 1971 | 43.907.885 US$ | - |
| 1970 | 37.142.857 US$ | - |
| 1969 | 48.985.714 US$ | - |
| 1968 | 42.699.969 US$ | - |
| 1967 | 37.099.985 US$ | - |
| 1966 | 38.499.998 US$ | - |
| 1965 | 41.804.010 US$ | - |
| 1964 | 36.679.918 US$ | - |
| 1963 | 34.299.919 US$ | - |
| 1962 | 26.039.938 US$ | - |
| 1961 | 30.659.934 US$ | - |
| 1960 | 22.945.944 US$ | - |
Las exportaciones de bienes y servicios de Somalia son de 3,8 mil millones de US$ (2025), y las de Eritrea, de 375 millones de US$ (2011).
Somalia vs Eritrea: cifras de exportaciones
|
Somalia
|
Eritrea
|
|
|---|---|---|
| Exportaciones | 3800 M US$ (2025) | 375 M US$ (2011) |
| Puesto mundial | 138/176 | n/d |
| Porcentaje del mundo | 0,01 % | 0,002 % |
| % del PIB | 29,2 % | 18,2 % |
| Mayor categoría de bienes | Animales, carne, pescado, lácteos, cueros y pieles (87,7 %, 2025) | n/d |
| Principal destino de bienes | Arabia Saudí (49,7 %, 2025) | n/d |
Comparar las exportaciones de 2 países cualesquiera
Fuentes:
- Banco Mundial | Economía y crecimiento (1960–2025, actualizado en octubre de 2026)
- TradeMap (2025, actualizado en octubre de 2026)
Creative Commons Atribución (CC BY): puedes copiar, compartir, adaptar y reutilizar este contenido, también con fines comerciales, siempre que cites a statistics.wiki e indiques los cambios que hayas hecho. Las fuentes indicadas arriba pueden tener sus propias condiciones de licencia.