
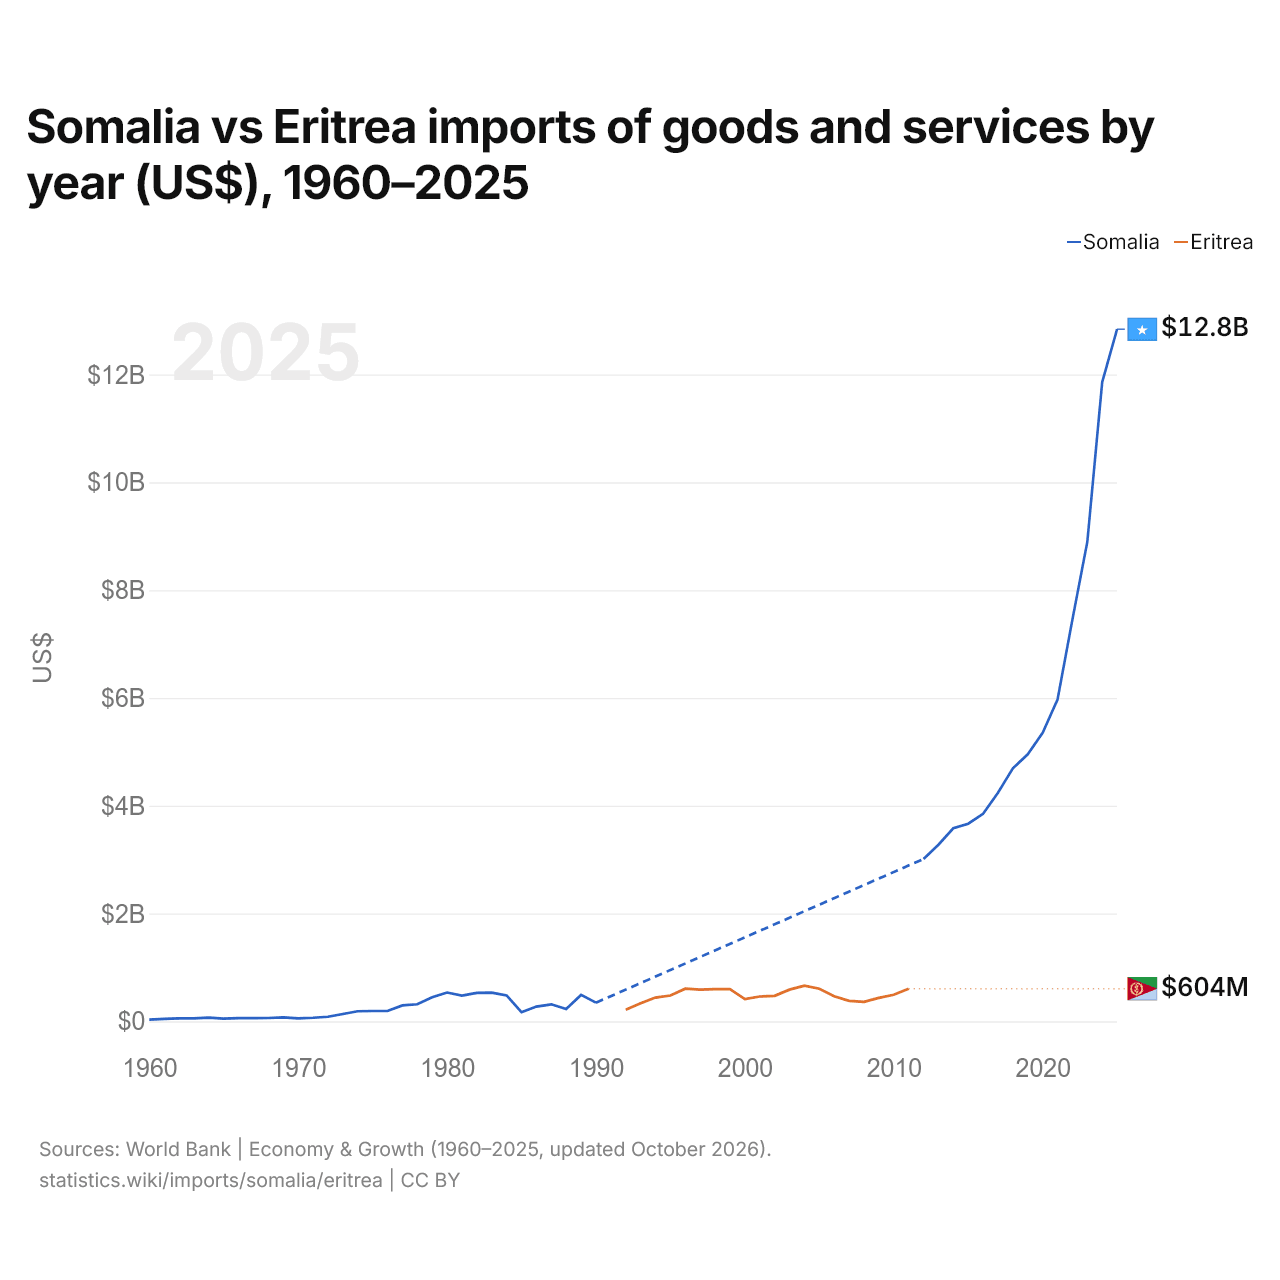
Somalia vs Eritrea: importaciones de bienes y servicios por año (US$), 1960–2025
1x
| Año | US$ | |
|---|---|---|
 Somalia |
 Eritrea |
|
| 2025 | 12.841.200.001 US$ | - |
| 2024 | 11.861.000.000 US$ | - |
| 2023 | 8.896.000.000 US$ | - |
| 2022 | 7.456.000.000 US$ | - |
| 2021 | 5.969.000.000 US$ | - |
| 2020 | 5.353.000.000 US$ | - |
| 2019 | 4.954.000.000 US$ | - |
| 2018 | 4.693.000.000 US$ | - |
| 2017 | 4.239.776.470 US$ | - |
| 2016 | 3.850.891.890 US$ | - |
| 2015 | 3.667.158.480 US$ | - |
| 2014 | 3.582.435.080 US$ | - |
| 2013 | 3.276.855.450 US$ | - |
| 2012 | 3.012.549.730 US$ | - |
| 2011 | - | 603.784.852 US$ |
| 2010 | - | 494.229.450 US$ |
| 2009 | - | 435.274.751 US$ |
| 2008 | - | 360.673.607 US$ |
| 2007 | - | 379.414.634 US$ |
| 2006 | - | 464.617.886 US$ |
| 2005 | - | 603.478.012 US$ |
| 2004 | - | 663.164.475 US$ |
| 2003 | - | 587.987.562 US$ |
| 2002 | - | 472.665.962 US$ |
| 2001 | - | 460.870.323 US$ |
| 2000 | - | 411.183.688 US$ |
| 1999 | - | 597.463.421 US$ |
| 1998 | - | 597.112.442 US$ |
| 1997 | - | 589.008.181 US$ |
| 1996 | - | 606.037.724 US$ |
| 1995 | - | 479.375.000 US$ |
| 1994 | - | 440.568.182 US$ |
| 1993 | - | 334.544.481 US$ |
| 1992 | - | 214.474.287 US$ |
| 1991 | - | - |
| 1990 | 346.105.374 US$ | - |
| 1989 | 490.450.254 US$ | - |
| 1988 | 230.343.008 US$ | - |
| 1987 | 315.205.176 US$ | - |
| 1986 | 273.465.478 US$ | - |
| 1985 | 169.206.457 US$ | - |
| 1984 | 481.494.597 US$ | - |
| 1983 | 533.432.443 US$ | - |
| 1982 | 526.993.564 US$ | - |
| 1981 | 477.996.187 US$ | - |
| 1980 | 534.102.368 US$ | - |
| 1979 | 445.931.809 US$ | - |
| 1978 | 316.988.818 US$ | - |
| 1977 | 295.217.382 US$ | - |
| 1976 | 192.486.095 US$ | - |
| 1975 | 191.088.160 US$ | - |
| 1974 | 186.973.779 US$ | - |
| 1973 | 136.273.183 US$ | - |
| 1972 | 85.671.837 US$ | - |
| 1971 | 65.932.001 US$ | - |
| 1970 | 54.000.014 US$ | - |
| 1969 | 72.457.143 US$ | - |
| 1968 | 61.697.962 US$ | - |
| 1967 | 60.479.976 US$ | - |
| 1966 | 58.099.990 US$ | - |
| 1965 | 50.301.993 US$ | - |
| 1964 | 69.859.927 US$ | - |
| 1963 | 56.139.924 US$ | - |
| 1962 | 55.999.933 US$ | - |
| 1961 | 44.239.946 US$ | - |
| 1960 | 30.939.959 US$ | - |
Las importaciones de bienes y servicios de Somalia son de 12,8 mil millones de US$ (2025), y las de Eritrea, de 604 millones de US$ (2011).
Somalia vs Eritrea: cifras de importaciones
|
Somalia
|
Eritrea
|
|
|---|---|---|
| Importaciones | 12,8 mil M US$ (2025) | 604 M US$ (2011) |
| Puesto mundial | 110/174 | n/d |
| Porcentaje del mundo | 0,04 % | 0,003 % |
| % del PIB | 98,8 % | 29,2 % |
| Mayor categoría de bienes | Alimentos elaborados, aceites, piensos, bebidas y tabaco (27,6 %, 2025) | n/d |
| Principal origen de bienes | China (30 %, 2025) | n/d |
Comparar las importaciones de 2 países cualesquiera
Fuentes:
- Banco Mundial | Economía y crecimiento (1960–2025, actualizado en octubre de 2026)
- TradeMap (2025, actualizado en octubre de 2026)
Creative Commons Atribución (CC BY): puedes copiar, compartir, adaptar y reutilizar este contenido, también con fines comerciales, siempre que cites a statistics.wiki e indiques los cambios que hayas hecho. Las fuentes indicadas arriba pueden tener sus propias condiciones de licencia.