
Uganda vs República del Congo: gasto militar (US$), 1961–2025
| Año | US$ | |
|---|---|---|
 Uganda |
 Congo (Rep.) |
|
| 2025 | 1.213.142.504 US$ | 213.498.193 US$ |
| 2024 | 1.063.750.546 US$ | 193.756.999 US$ |
| 2023 | 915.726.902 US$ | 308.217.598 US$ |
| 2022 | 840.775.434 US$ | 301.786.545 US$ |
| 2021 | 947.645.290 US$ | 346.972.879 US$ |
| 2020 | 927.858.714 US$ | 298.322.038 US$ |
| 2019 | 607.278.073 US$ | 299.977.303 US$ |
| 2018 | 379.468.140 US$ | 292.417.024 US$ |
| 2017 | 319.440.777 US$ | 376.115.493 US$ |
| 2016 | 293.013.978 US$ | 502.273.337 US$ |
| 2015 | 319.557.958 US$ | - |
| 2014 | 301.493.926 US$ | 706.085.270 US$ |
| 2013 | 271.184.098 US$ | 367.161.648 US$ |
| 2012 | 321.151.088 US$ | - |
| 2011 | 707.603.653 US$ | - |
| 2010 | 656.191.699 US$ | 218.603.979 US$ |
| 2009 | 359.909.889 US$ | - |
| 2008 | 194.562.059 US$ | 208.565.003 US$ |
| 2007 | 165.977.916 US$ | 168.301.975 US$ |
| 2006 | 150.006.551 US$ | 126.682.147 US$ |
| 2005 | 155.618.308 US$ | 100.956.199 US$ |
| 2004 | 140.223.722 US$ | 113.638.567 US$ |
| 2003 | 111.767.858 US$ | 85.220.825 US$ |
| 2002 | 100.999.418 US$ | 64.427.839 US$ |
| 2001 | 98.309.998 US$ | 50.123.226 US$ |
| 2000 | 109.286.511 US$ | - |
| 1999 | 159.305.886 US$ | - |
| 1998 | 160.824.633 US$ | - |
| 1997 | 132.703.432 US$ | - |
| 1996 | 133.640.396 US$ | - |
| 1995 | 120.959.139 US$ | - |
| 1994 | 80.438.393 US$ | - |
| 1993 | 62.198.489 US$ | 97.840.083 US$ |
| 1992 | 47.410.303 US$ | 112.321.563 US$ |
| 1991 | 83.308.917 US$ | - |
| 1990 | 127.777.222 US$ | - |
| 1989 | 144.046.757 US$ | - |
| 1988 | 160.112.036 US$ | - |
| 1987 | 162.129.859 US$ | 100.507.591 US$ |
| 1986 | 114.006.253 US$ | - |
| 1985 | 93.684.759 US$ | 55.646.697 US$ |
| 1984 | 94.972.177 US$ | 49.423.665 US$ |
| 1983 | 49.702.657 US$ | - |
| 1982 | 43.027.065 US$ | 72.274.414 US$ |
| 1981 | 25.248.709 US$ | 63.535.155 US$ |
| 1980 | 27.595.805 US$ | 57.416.819 US$ |
| 1979 | 36.089.634 US$ | 52.669.622 US$ |
| 1978 | 47.598.058 US$ | 37.960.459 US$ |
| 1977 | 59.788.539 US$ | 37.903.227 US$ |
| 1976 | 77.953.456 US$ | 35.704.034 US$ |
| 1975 | 66.608.719 US$ | 34.500.395 US$ |
| 1974 | 76.083.430 US$ | 24.824.588 US$ |
| 1973 | 59.492.208 US$ | 22.872.755 US$ |
| 1972 | 60.565.768 US$ | 14.495.271 US$ |
| 1971 | 49.157.611 US$ | 14.818.672 US$ |
| 1970 | 24.851.382 US$ | 13.364.197 US$ |
| 1969 | 21.321.262 US$ | - |
| 1968 | 18.611.420 US$ | - |
| 1967 | 15.702.976 US$ | - |
| 1966 | 13.299.912 US$ | - |
| 1965 | 10.020.876 US$ | - |
| 1964 | 3.836.962 US$ | - |
| 1963 | 1.906.846 US$ | - |
| 1962 | 508.850 US$ | - |
| 1961 | 97.714 US$ | - |
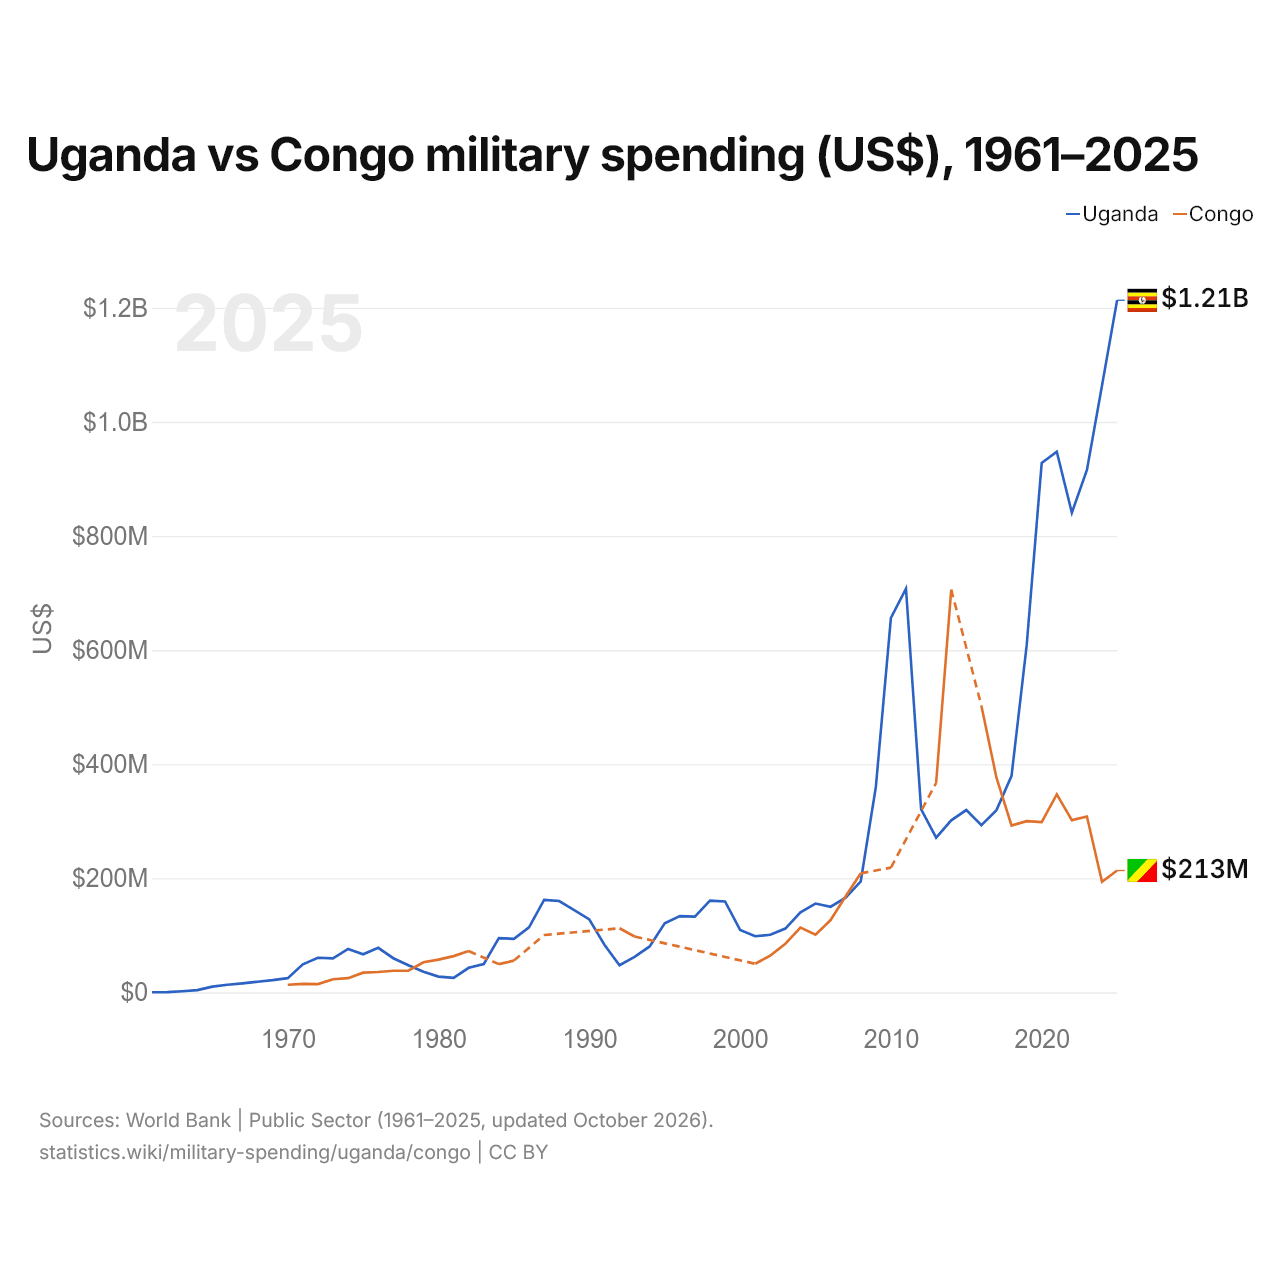
En 2025, el gasto militar fue de 1,21 mil millones de US$ en Uganda y de 213 millones de US$ en la República del Congo: 5,7 veces más en Uganda. En 1970 fue de 24,9 millones de US$ en Uganda y de 13,4 millones de US$ en la República del Congo, 1,9 veces más en Uganda.
Uganda vs República del Congo: gasto militar en % del PIB, 1961–2025
| Año | % del PIB | |
|---|---|---|
|
Uganda
|
Congo (Rep.)
|
|
| 2025 | 2 % | 1,3 % |
| 2024 | 2 % | 1,2 % |
| 2023 | 1,9 % | 2 % |
| 2022 | 1,8 % | 1,9 % |
| 2021 | 2,3 % | 2,3 % |
| 2020 | 2,5 % | 2,6 % |
| 2019 | 1,7 % | 2,1 % |
| 2018 | 1,2 % | 2 % |
| 2017 | 1 % | 3,2 % |
| 2016 | 1 % | 4,6 % |
| 2015 | 1 % | - |
| 2014 | 0,9 % | 3,9 % |
| 2013 | 0,9 % | 2 % |
| 2012 | 1,2 % | - |
| 2011 | 2,5 % | - |
| 2010 | 2,5 % | 1,7 % |
| 2009 | 1,4 % | - |
| 2008 | 1,3 % | 1,8 % |
| 2007 | 1,4 % | 1,9 % |
| 2006 | 1,5 % | 1,6 % |
| 2005 | 1,7 % | 1,5 % |
| 2004 | 1,8 % | 2,4 % |
| 2003 | 1,7 % | 2,4 % |
| 2002 | 1,6 % | 2,1 % |
| 2001 | 1,7 % | 1,8 % |
| 2000 | 1,8 % | - |
| 1999 | 2,7 % | - |
| 1998 | 2,4 % | - |
| 1997 | 2,1 % | - |
| 1996 | 2,2 % | - |
| 1995 | 2,1 % | - |
| 1994 | 2 % | - |
| 1993 | 1,9 % | 3,6 % |
| 1992 | 1,7 % | 3,8 % |
| 1991 | 2,5 % | - |
| 1990 | 3 % | - |
| 1989 | 2,7 % | - |
| 1988 | 2,5 % | - |
| 1987 | 2,6 % | 4,4 % |
| 1986 | 2,9 % | - |
| 1985 | 2,7 % | 2,6 % |
| 1984 | 2,6 % | 2,3 % |
| 1983 | 2,2 % | - |
| 1982 | 2 % | 3,3 % |
| 1981 | 1,9 % | 3,2 % |
| 1980 | 2,2 % | 3,4 % |
| 1979 | 1,7 % | 4,4 % |
| 1978 | 2 % | 4,3 % |
| 1977 | 2 % | 5 % |
| 1976 | 3,2 % | 4,7 % |
| 1975 | 2,8 % | 4,5 % |
| 1974 | 3,6 % | 4,2 % |
| 1973 | 3,5 % | 4,2 % |
| 1972 | 4,1 % | 3,5 % |
| 1971 | 3,5 % | 4,6 % |
| 1970 | 2 % | 4,9 % |
| 1969 | 1,8 % | - |
| 1968 | 1,8 % | - |
| 1967 | 1,6 % | - |
| 1966 | 1,4 % | - |
| 1965 | 1,1 % | - |
| 1964 | 0,7 % | - |
| 1963 | 0,4 % | - |
| 1962 | 0,1 % | - |
| 1961 | 0 % | - |
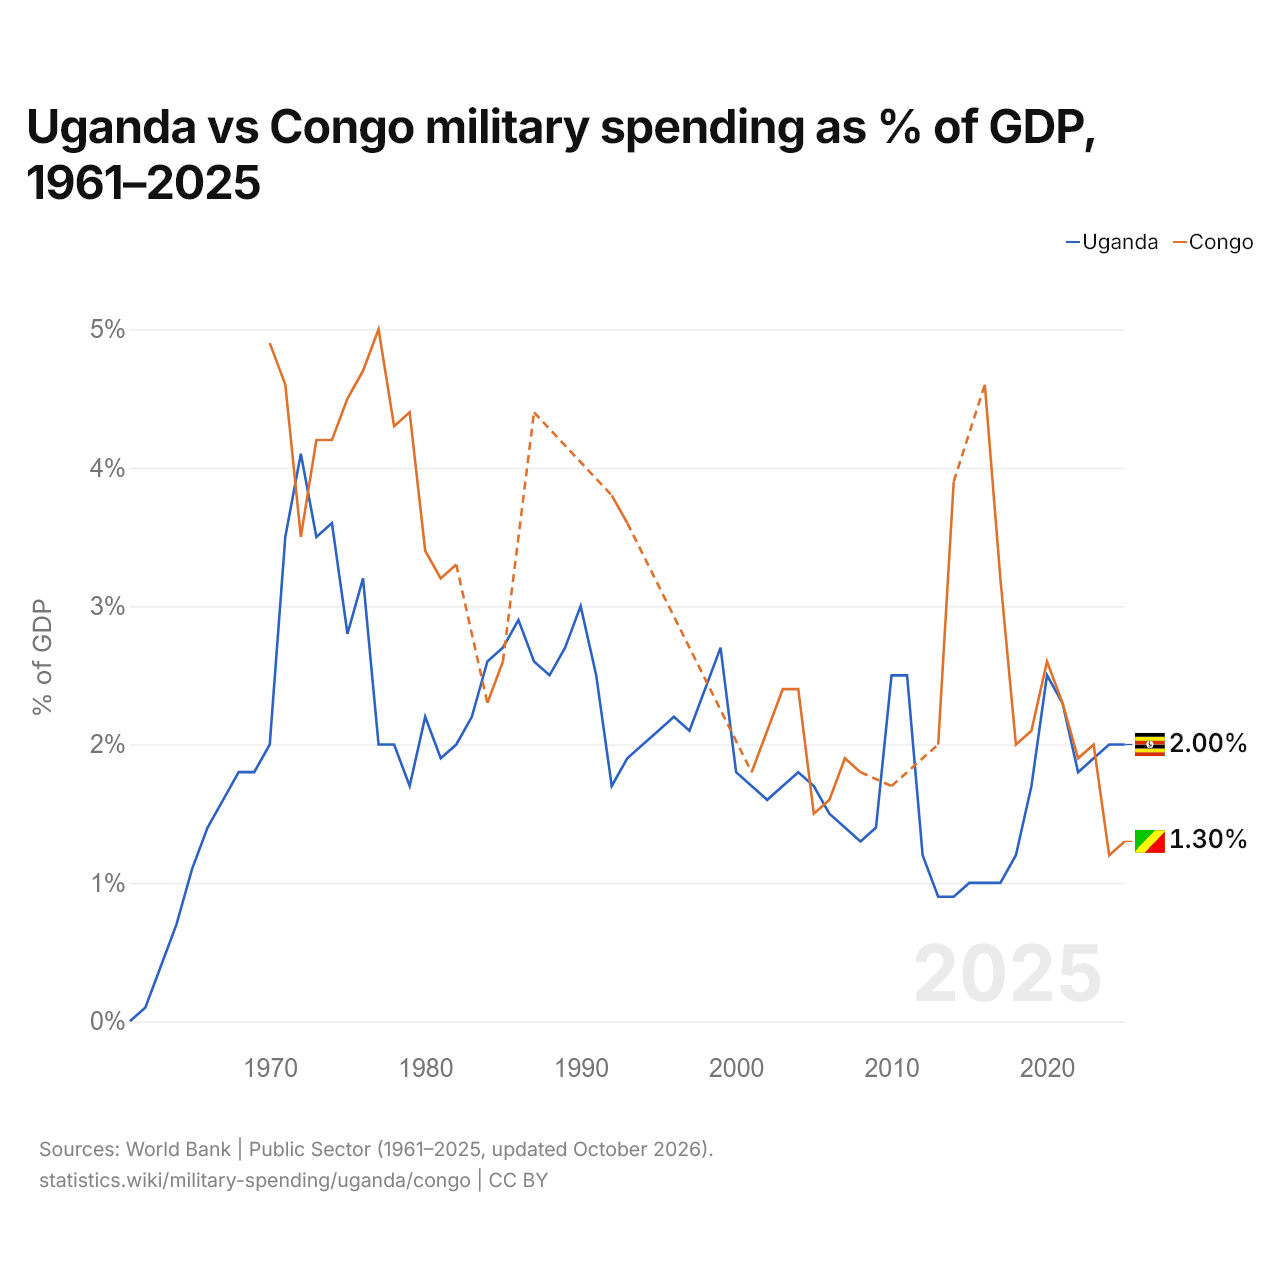
En 2025, el gasto militar fue del 2,0 % del PIB en Uganda y del 1,3 % en la República del Congo: 0,7 puntos porcentuales más en Uganda. En 2014 fue del 0,9 % en Uganda y del 3,9 % en la República del Congo, 3,0 puntos porcentuales más en la República del Congo.
La diferencia fue máxima en 2016, cuando el gasto militar de la República del Congo superó al de Uganda en 3,6 puntos porcentuales del PIB.
Uganda vs República del Congo: datos del gasto militar
|
Uganda
|
Congo (Rep.)
|
|
|---|---|---|
| US$, 2025 | 1210 M US$ | 213 M US$ |
| % del PIB, 2025 | 2,0 % | 1,3 % |
| Por persona, US$ | 23,6 US$ | 32,9 US$ |
| Porcentaje del mundo | 0,04 % | 0,007 % |
| Puesto mundial | 81/154 | 127/154 |
Comparar el gasto militar de 2 países cualesquiera
Fuentes:
- Banco Mundial | Sector público (1961–2025, actualizado en octubre de 2026)
Creative Commons Atribución (CC BY): puedes copiar, compartir, adaptar y reutilizar este contenido, también con fines comerciales, siempre que cites a statistics.wiki e indiques los cambios que hayas hecho. Las fuentes indicadas arriba pueden tener sus propias condiciones de licencia.