
Pakistán vs Nigeria: gasto militar (US$), 1960–2025
| Año | US$ | |
|---|---|---|
 Pakistán |
 Nigeria |
|
| 2025 | 11.867.353.975 US$ | 2.644.614.569 US$ |
| 2024 | 10.148.530.941 US$ | 1.401.136.565 US$ |
| 2023 | 9.733.805.487 US$ | 4.106.994.160 US$ |
| 2022 | 11.909.634.966 US$ | 4.206.255.087 US$ |
| 2021 | 11.812.061.426 US$ | 6.168.850.667 US$ |
| 2020 | 10.474.876.919 US$ | 3.783.205.846 US$ |
| 2019 | 11.250.573.674 US$ | 3.068.269.245 US$ |
| 2018 | 12.774.181.170 US$ | 2.137.984.013 US$ |
| 2017 | 11.412.397.576 US$ | 1.618.228.720 US$ |
| 2016 | 10.048.004.917 US$ | 1.751.919.424 US$ |
| 2015 | 9.487.808.309 US$ | 2.059.059.568 US$ |
| 2014 | 8.403.822.344 US$ | 2.381.247.879 US$ |
| 2013 | 7.987.387.137 US$ | 2.442.965.974 US$ |
| 2012 | 7.742.745.270 US$ | 2.339.643.131 US$ |
| 2011 | 6.731.383.052 US$ | 2.400.703.027 US$ |
| 2010 | 5.983.696.738 US$ | 1.978.926.530 US$ |
| 2009 | 6.116.998.267 US$ | 1.492.318.796 US$ |
| 2008 | 6.994.977.847 US$ | 1.660.324.608 US$ |
| 2007 | 6.467.001.759 US$ | 1.030.552.489 US$ |
| 2006 | 5.900.625.105 US$ | 830.718.631 US$ |
| 2005 | 5.658.805.858 US$ | 698.155.139 US$ |
| 2004 | 5.230.511.980 US$ | 666.600.446 US$ |
| 2003 | 4.597.615.030 US$ | 597.753.114 US$ |
| 2002 | 3.989.170.297 US$ | 907.137.051 US$ |
| 2001 | 3.768.214.371 US$ | 573.983.505 US$ |
| 2000 | 4.147.245.552 US$ | 375.968.729 US$ |
| 1999 | 3.268.279.745 US$ | 505.936.234 US$ |
| 1998 | 3.367.753.517 US$ | 1.197.603.096 US$ |
| 1997 | 3.509.513.229 US$ | 875.377.848 US$ |
| 1996 | 3.822.743.973 US$ | 754.395.011 US$ |
| 1995 | 3.529.155.975 US$ | 681.429.936 US$ |
| 1994 | 3.097.628.998 US$ | 628.284.616 US$ |
| 1993 | 3.329.990.628 US$ | 529.331.233 US$ |
| 1992 | 3.274.387.010 US$ | 293.613.721 US$ |
| 1991 | 2.998.019.333 US$ | 460.553.927 US$ |
| 1990 | 2.609.607.979 US$ | 450.180.482 US$ |
| 1989 | 2.624.268.005 US$ | 255.171.397 US$ |
| 1988 | 2.610.687.510 US$ | 439.066.892 US$ |
| 1987 | 2.325.228.627 US$ | 405.496.840 US$ |
| 1986 | 2.230.273.249 US$ | 718.808.158 US$ |
| 1985 | 2.155.893.030 US$ | 1.059.569.829 US$ |
| 1984 | 2.074.553.156 US$ | 1.144.000.713 US$ |
| 1983 | 1.906.231.215 US$ | 2.155.352.955 US$ |
| 1982 | 1.959.001.019 US$ | 3.236.869.421 US$ |
| 1981 | 1.604.789.243 US$ | 4.556.081.808 US$ |
| 1980 | 1.306.492.794 US$ | 2.115.836.530 US$ |
| 1979 | 1.073.661.575 US$ | 2.042.731.278 US$ |
| 1978 | 980.221.053 US$ | 1.945.491.388 US$ |
| 1977 | 839.104.852 US$ | 2.170.815.451 US$ |
| 1976 | 775.530.431 US$ | 2.102.791.878 US$ |
| 1975 | 709.945.036 US$ | 2.256.779.661 US$ |
| 1974 | 542.049.452 US$ | 1.079.340.938 US$ |
| 1973 | 396.451.999 US$ | 830.693.069 US$ |
| 1972 | 646.430.835 US$ | 661.624.027 US$ |
| 1971 | 718.405.016 US$ | 403.274.336 US$ |
| 1970 | 617.532.901 US$ | 662.339.735 US$ |
| 1969 | 478.617.009 US$ | 684.459.726 US$ |
| 1968 | 410.456.077 US$ | 476.366.592 US$ |
| 1967 | 403.427.222 US$ | 302.214.497 US$ |
| 1966 | 441.596.869 US$ | 70.109.372 US$ |
| 1965 | 350.101.423 US$ | 82.328.827 US$ |
| 1964 | 201.217.876 US$ | 68.506.752 US$ |
| 1963 | 168.951.707 US$ | 56.986.315 US$ |
| 1962 | 157.574.105 US$ | 53.855.094 US$ |
| 1961 | 168.777.676 US$ | 37.947.525 US$ |
| 1960 | 161.693.151 US$ | 29.198.381 US$ |
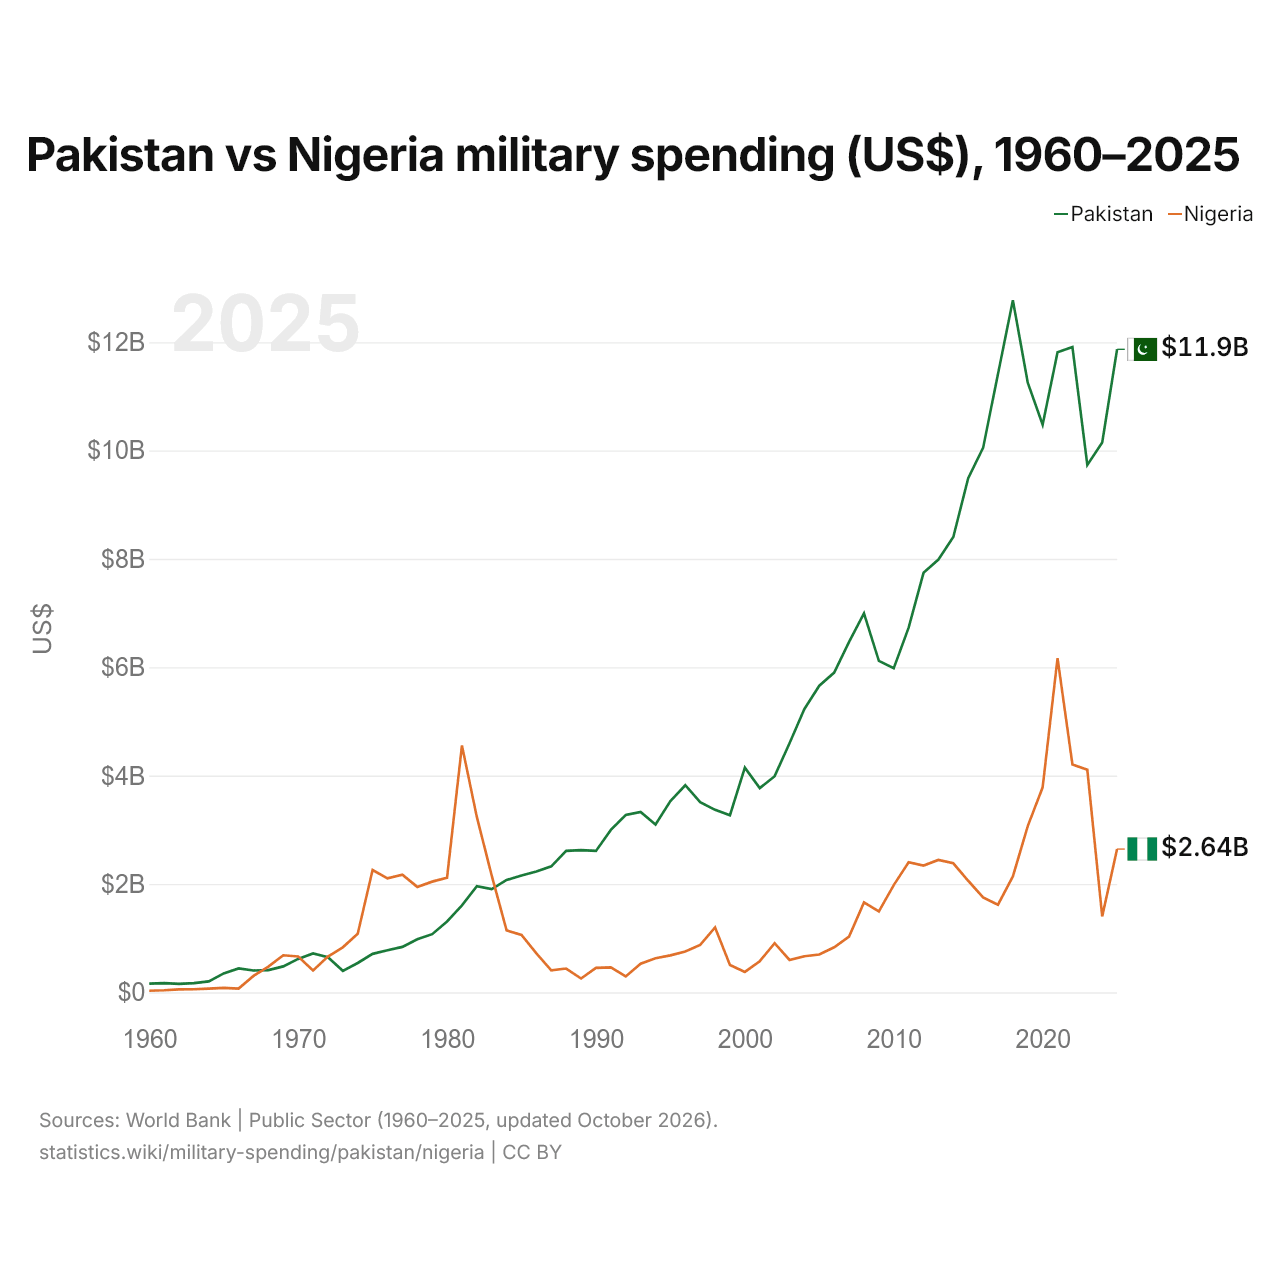
En 2025, el gasto militar fue de 11,9 mil millones de US$ en Pakistán y de 2,64 mil millones de US$ en Nigeria: 4,5 veces más en Pakistán. En 1960 fue de 162 millones de US$ en Pakistán y de 29,2 millones de US$ en Nigeria, 5,5 veces más en Pakistán.
Pakistán vs Nigeria: gasto militar en % del PIB, 1960–2025
| Año | % del PIB | |
|---|---|---|
|
Pakistán
|
Nigeria
|
|
| 2025 | 2,9 % | 0,9 % |
| 2024 | 2,7 % | 0,6 % |
| 2023 | 2,9 % | 0,8 % |
| 2022 | 3,2 % | 0,7 % |
| 2021 | 3,4 % | 1 % |
| 2020 | 3,5 % | 0,6 % |
| 2019 | 3,5 % | 0,5 % |
| 2018 | 3,6 % | 0,5 % |
| 2017 | 3,4 % | 0,4 % |
| 2016 | 3,2 % | 0,4 % |
| 2015 | 3,2 % | 0,4 % |
| 2014 | 3,1 % | 0,4 % |
| 2013 | 3,1 % | 0,5 % |
| 2012 | 3,1 % | 0,5 % |
| 2011 | 2,9 % | 0,6 % |
| 2010 | 3 % | 0,5 % |
| 2009 | 3,3 % | 0,5 % |
| 2008 | 3,5 % | 0,5 % |
| 2007 | 3,5 % | 0,4 % |
| 2006 | 3,6 % | 0,3 % |
| 2005 | 3,9 % | 0,4 % |
| 2004 | 4 % | 0,5 % |
| 2003 | 4,1 % | 0,6 % |
| 2002 | 4,1 % | 1 % |
| 2001 | 3,9 % | 0,8 % |
| 2000 | 4,2 % | 0,5 % |
| 1999 | 5,2 % | 0,9 % |
| 1998 | 5,4 % | 0,5 % |
| 1997 | 5,6 % | 0,4 % |
| 1996 | 6 % | 0,4 % |
| 1995 | 5,8 % | 0,5 % |
| 1994 | 5,9 % | 0,8 % |
| 1993 | 6,4 % | 0,9 % |
| 1992 | 6,7 % | 0,6 % |
| 1991 | 6,6 % | 0,8 % |
| 1990 | 6,5 % | 0,8 % |
| 1989 | 6,5 % | 0,6 % |
| 1988 | 6,8 % | 0,9 % |
| 1987 | 7 % | 0,8 % |
| 1986 | 7 % | 1,3 % |
| 1985 | 6,9 % | 1,4 % |
| 1984 | 6,7 % | 1,6 % |
| 1983 | 6,6 % | 2,2 % |
| 1982 | 6,4 % | 2,3 % |
| 1981 | 5,7 % | 2,8 % |
| 1980 | 5,5 % | 3,3 % |
| 1979 | 5,5 % | 4,3 % |
| 1978 | 5,5 % | 5,3 % |
| 1977 | 5,5 % | 6 % |
| 1976 | 5,9 % | 5,8 % |
| 1975 | 6,3 % | 8,1 % |
| 1974 | 6,1 % | 4,3 % |
| 1973 | 6,2 % | 5,5 % |
| 1972 | 6,9 % | 5,4 % |
| 1971 | 6,7 % | 4,4 % |
| 1970 | 6,2 % | 5,3 % |
| 1969 | 5,5 % | 10,3 % |
| 1968 | 5,1 % | 9,2 % |
| 1967 | 5,4 % | 5,8 % |
| 1966 | 6,7 % | 1,1 % |
| 1965 | 5,9 % | 1,4 % |
| 1964 | 3,9 % | 1,2 % |
| 1963 | 3,6 % | 1,1 % |
| 1962 | 3,7 % | 1,1 % |
| 1961 | 4,1 % | 0,8 % |
| 1960 | 4,3 % | 0,7 % |
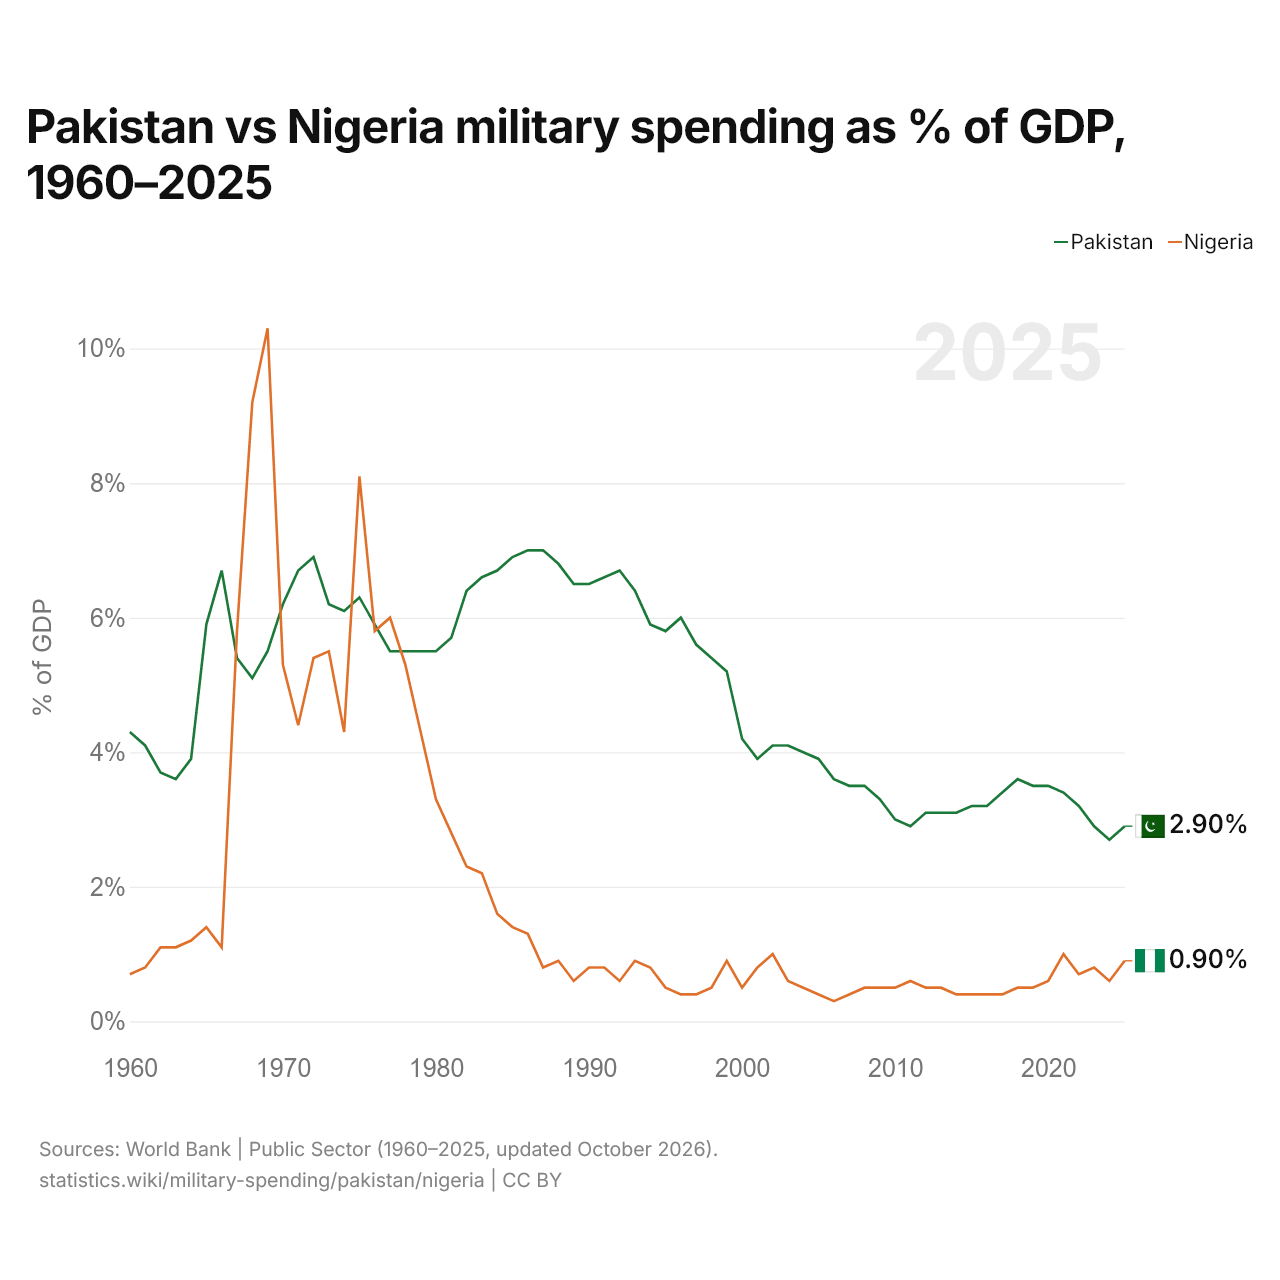
En 2025, el gasto militar fue del 2,9 % del PIB en Pakistán y del 0,9 % en Nigeria: 2,0 puntos porcentuales más en Pakistán. En 2015 fue del 3,2 % en Pakistán y del 0,4 % en Nigeria, 2,8 puntos porcentuales más en Pakistán.
El gasto militar de Pakistán, como porcentaje del PIB, ha sido más alto que el de Nigeria todos los años desde 1978. La diferencia fue máxima en 1987, cuando el gasto militar de Pakistán superó al de Nigeria en 6,2 puntos porcentuales del PIB.
Pakistán vs Nigeria: datos del gasto militar
|
Pakistán
|
Nigeria
|
|
|---|---|---|
| US$, 2025 | 11,9 mil M US$ | 2640 M US$ |
| % del PIB, 2025 | 2,9 % | 0,9 % |
| Por persona, US$ | 46,5 US$ | 11,1 US$ |
| Porcentaje del mundo | 0,42 % | 0,09 % |
| Puesto mundial | 31/154 | 62/154 |
Comparar el gasto militar de 2 países cualesquiera
Fuentes:
- Banco Mundial | Sector público (1960–2025, actualizado en octubre de 2026)
Creative Commons Atribución (CC BY): puedes copiar, compartir, adaptar y reutilizar este contenido, también con fines comerciales, siempre que cites a statistics.wiki e indiques los cambios que hayas hecho. Las fuentes indicadas arriba pueden tener sus propias condiciones de licencia.