
Guinea vs Guinea Ecuatorial: exportaciones de servicios de TI y de propiedad intelectual, 2000–2025 (incluye telecomunicaciones)
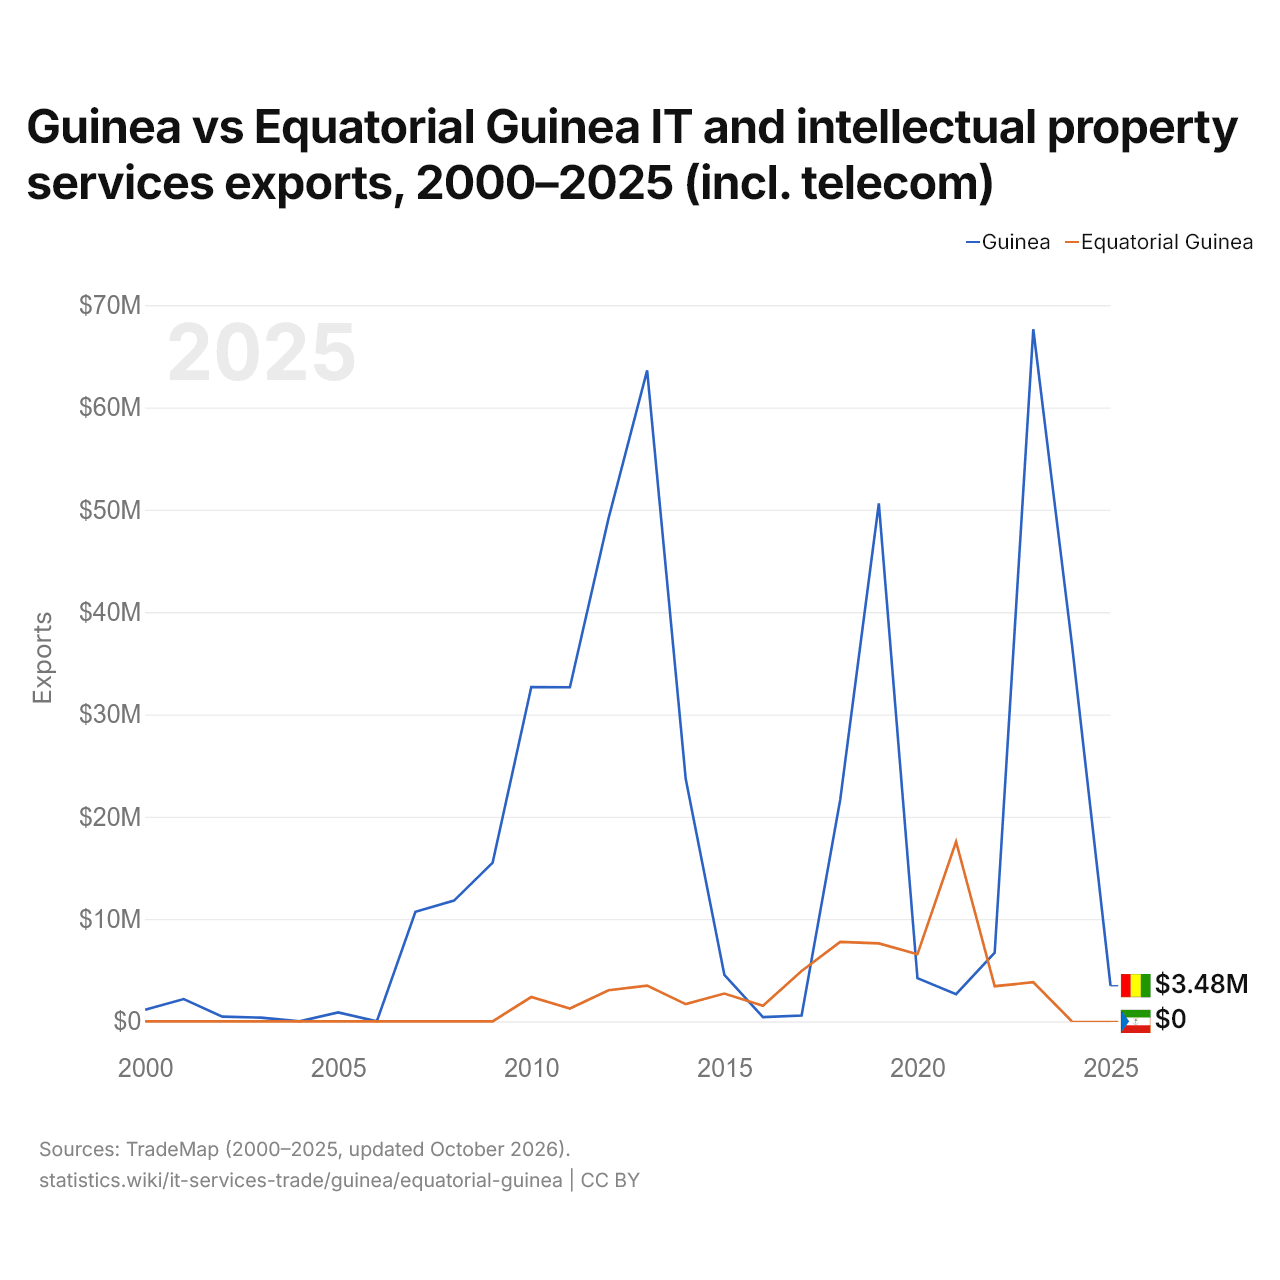
| Año | Exportaciones | |
|---|---|---|
 Guinea |
 Guinea Ecuatorial |
|
| 2025 | 3.480.000 US$ | - |
| 2024 | 36.860.000 US$ | 0 US$ |
| 2023 | 67.640.000 US$ | 3.822.000 US$ |
| 2022 | 6.700.000 US$ | 3.434.000 US$ |
| 2021 | 2.660.000 US$ | 17.559.000 US$ |
| 2020 | 4.220.000 US$ | 6.558.000 US$ |
| 2019 | 50.630.000 US$ | 7.620.000 US$ |
| 2018 | 21.660.000 US$ | 7.769.000 US$ |
| 2017 | 570.000 US$ | 4.924.000 US$ |
| 2016 | 414.000 US$ | 1.527.000 US$ |
| 2015 | 4.542.000 US$ | 2.718.000 US$ |
| 2014 | 23.676.000 US$ | 1.683.000 US$ |
| 2013 | 63.620.000 US$ | 3.493.000 US$ |
| 2012 | 49.150.000 US$ | 3.038.000 US$ |
| 2011 | 32.650.000 US$ | 1.250.000 US$ |
| 2010 | 32.670.000 US$ | 2.379.000 US$ |
| 2009 | 15.510.000 US$ | 0 US$ |
| 2008 | 11.800.000 US$ | 0 US$ |
| 2007 | 10.710.000 US$ | 0 US$ |
| 2006 | 0 US$ | 0 US$ |
| 2005 | 880.000 US$ | 0 US$ |
| 2004 | 0 US$ | 0 US$ |
| 2003 | 360.000 US$ | 0 US$ |
| 2002 | 460.000 US$ | 0 US$ |
| 2001 | 2.178.000 US$ | 0 US$ |
| 2000 | 1.139.000 US$ | 0 US$ |
Las exportaciones de servicios de TI y de propiedad intelectual de Guinea fueron de 36,9 millones de US$ (2024) y las de Guinea Ecuatorial, de 0 US$ (2024). En 2000, las exportaciones fueron de 1,14 millones de US$ de Guinea y de 0 US$ de Guinea Ecuatorial.
Guinea vs Guinea Ecuatorial: importaciones de servicios de TI y de propiedad intelectual, 2000–2025
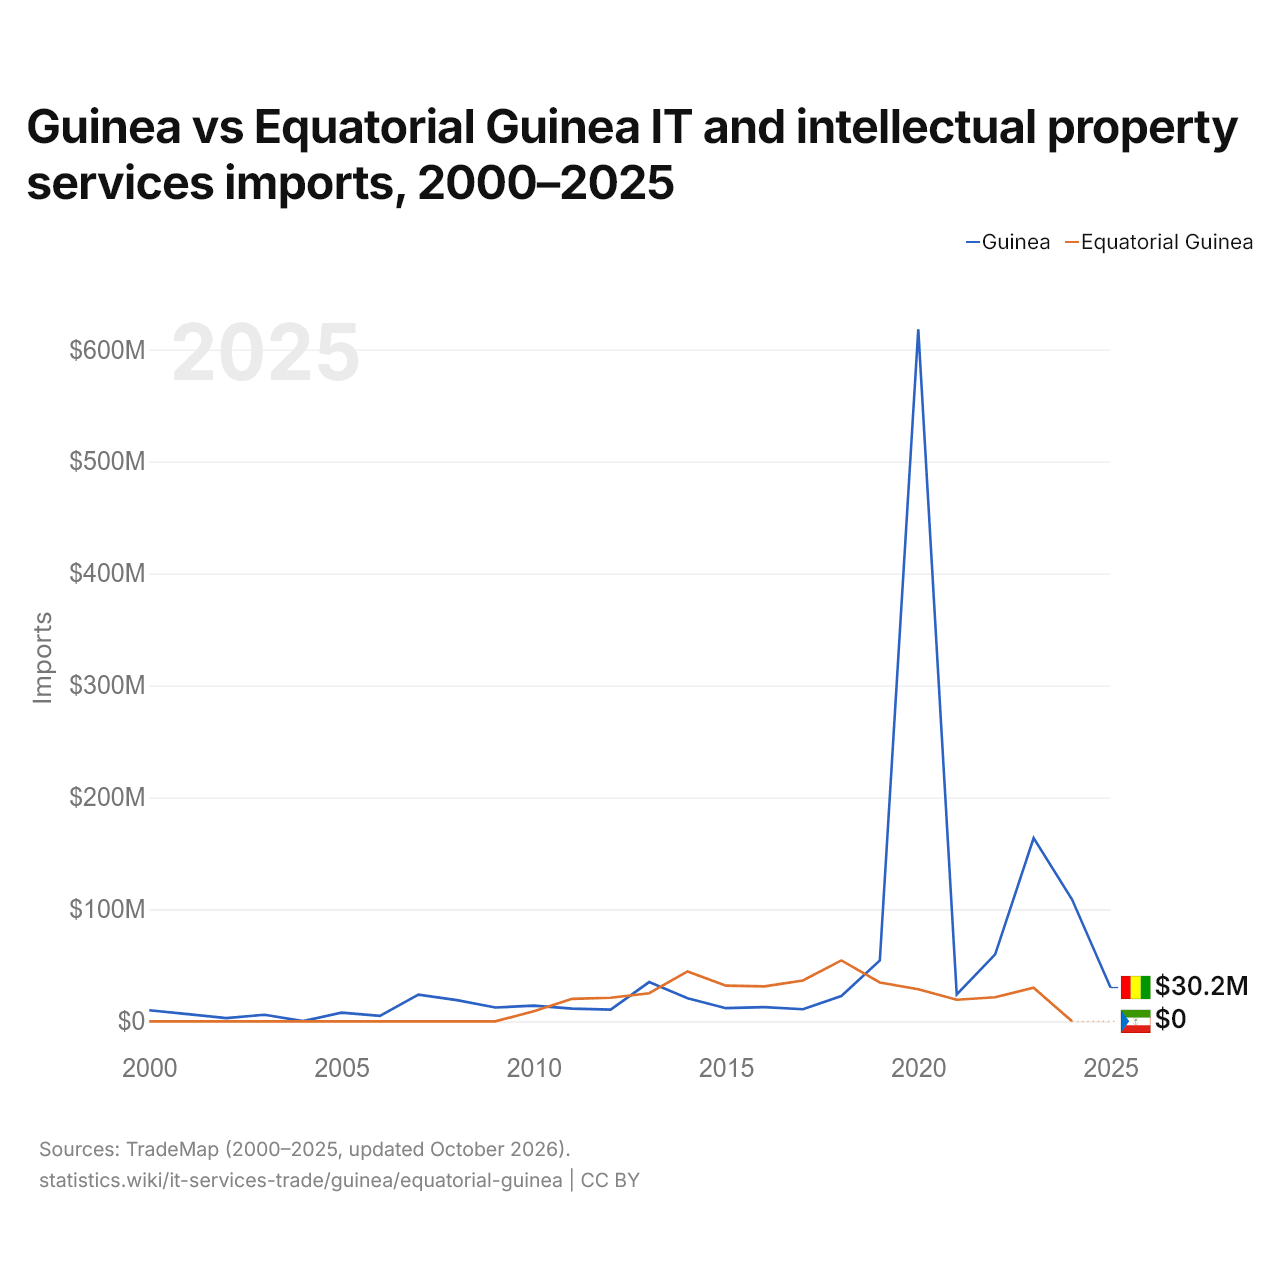
| Año | Importaciones | |
|---|---|---|
|
Guinea
|
Guinea Ecuatorial
|
|
| 2025 | 30.190.000 US$ | - |
| 2024 | 108.760.000 US$ | 0 US$ |
| 2023 | 163.740.000 US$ | 30.109.000 US$ |
| 2022 | 59.790.000 US$ | 21.503.000 US$ |
| 2021 | 24.070.000 US$ | 19.293.000 US$ |
| 2020 | 618.080.000 US$ | 28.601.000 US$ |
| 2019 | 54.340.000 US$ | 34.706.000 US$ |
| 2018 | 22.550.000 US$ | 54.426.000 US$ |
| 2017 | 10.800.000 US$ | 36.434.000 US$ |
| 2016 | 12.666.000 US$ | 31.260.000 US$ |
| 2015 | 11.754.000 US$ | 31.867.000 US$ |
| 2014 | 20.625.000 US$ | 44.593.000 US$ |
| 2013 | 35.060.000 US$ | 25.096.000 US$ |
| 2012 | 10.470.000 US$ | 21.083.000 US$ |
| 2011 | 11.320.000 US$ | 20.108.000 US$ |
| 2010 | 14.000.000 US$ | 8.996.000 US$ |
| 2009 | 12.340.000 US$ | 0 US$ |
| 2008 | 18.940.000 US$ | 0 US$ |
| 2007 | 23.820.000 US$ | 0 US$ |
| 2006 | 4.890.000 US$ | 0 US$ |
| 2005 | 7.800.000 US$ | 0 US$ |
| 2004 | 210.000 US$ | 0 US$ |
| 2003 | 5.840.000 US$ | 0 US$ |
| 2002 | 2.940.000 US$ | 0 US$ |
| 2001 | 6.496.000 US$ | 0 US$ |
| 2000 | 9.909.000 US$ | 0 US$ |
Las importaciones de servicios de TI y de propiedad intelectual de Guinea fueron de 109 millones de US$ (2024) y las de Guinea Ecuatorial, de 0 US$ (2024). En 2000, las importaciones fueron de 9,91 millones de US$ de Guinea y de 0 US$ de Guinea Ecuatorial.
Guinea vs Guinea Ecuatorial: cifras del comercio de servicios de TI y de propiedad intelectual
|
Guinea
|
Guinea Ecuatorial
|
|
|---|---|---|
| Exportaciones | 3,48 M US$ (2025) | 0 US$ (2024) |
| Importaciones | 30,2 M US$ (2025) | 0 US$ (2024) |
| Saldo | −26,7 M US$ (2025) | +0 US$ (2024) |
| Porcentaje del mundo | <0,001 % | 0 % |
| Puesto mundial | 154/179 | 175/179 |
| Principal comprador | n/d | n/d |
| Principal proveedor | n/d | n/d |
Comparar el comercio de servicios de TI y de propiedad intelectual de 2 países cualesquiera
Fuentes:
- TradeMap (2000–2025, actualizado en octubre de 2026)
Creative Commons Atribución (CC BY): puedes copiar, compartir, adaptar y reutilizar este contenido, también con fines comerciales, siempre que cites a statistics.wiki e indiques los cambios que hayas hecho. Las fuentes indicadas arriba pueden tener sus propias condiciones de licencia.