
Guinea vs Guinea Ecuatorial: exportaciones de bienes y servicios por año (US$), 1986–2025
| Año | US$ | |
|---|---|---|
 Guinea |
 Guinea Ecuatorial |
|
| 2025 | 11.738.637.526 US$ | 5.965.354.779 US$ |
| 2024 | 10.351.843.899 US$ | 5.961.375.350 US$ |
| 2023 | 9.888.943.025 US$ | 4.741.380.525 US$ |
| 2022 | 9.043.059.038 US$ | 7.249.945.761 US$ |
| 2021 | 9.596.023.581 US$ | 5.512.726.595 US$ |
| 2020 | 6.617.433.829 US$ | 4.041.173.656 US$ |
| 2019 | 4.710.654.158 US$ | 5.810.566.664 US$ |
| 2018 | 4.767.367.527 US$ | 7.807.722.846 US$ |
| 2017 | 4.611.027.664 US$ | 7.181.836.774 US$ |
| 2016 | 2.524.762.072 US$ | 5.779.217.937 US$ |
| 2015 | 1.890.478.291 US$ | 7.470.701.299 US$ |
| 2014 | 2.342.843.829 US$ | 14.357.208.631 US$ |
| 2013 | 2.217.341.683 US$ | 14.849.114.362 US$ |
| 2012 | 2.531.048.957 US$ | 16.098.337.026 US$ |
| 2011 | 2.212.106.803 US$ | 16.038.364.004 US$ |
| 2010 | 2.079.424.655 US$ | 13.991.011.076 US$ |
| 2009 | 1.512.364.188 US$ | 11.171.995.037 US$ |
| 2008 | 1.507.080.731 US$ | 17.621.714.169 US$ |
| 2007 | 1.479.451.796 US$ | 11.584.326.308 US$ |
| 2006 | 1.005.390.516 US$ | 8.303.800.359 US$ |
| 2005 | 1.021.679.587 US$ | 7.183.409.023 US$ |
| 2004 | 895.267.037 US$ | - |
| 2003 | 894.584.049 US$ | - |
| 2002 | 781.148.030 US$ | - |
| 2001 | 808.614.946 US$ | - |
| 2000 | 734.578.556 US$ | - |
| 1999 | 749.004.850 US$ | - |
| 1998 | 763.846.910 US$ | - |
| 1997 | 740.132.957 US$ | - |
| 1996 | 742.652.391 US$ | - |
| 1995 | 780.067.627 US$ | - |
| 1994 | 769.732.341 US$ | - |
| 1993 | 869.566.348 US$ | - |
| 1992 | 817.036.636 US$ | - |
| 1991 | 914.493.654 US$ | - |
| 1990 | 828.699.105 US$ | - |
| 1989 | 756.205.480 US$ | - |
| 1988 | 640.721.932 US$ | - |
| 1987 | 645.766.104 US$ | - |
| 1986 | 620.341.458 US$ | - |
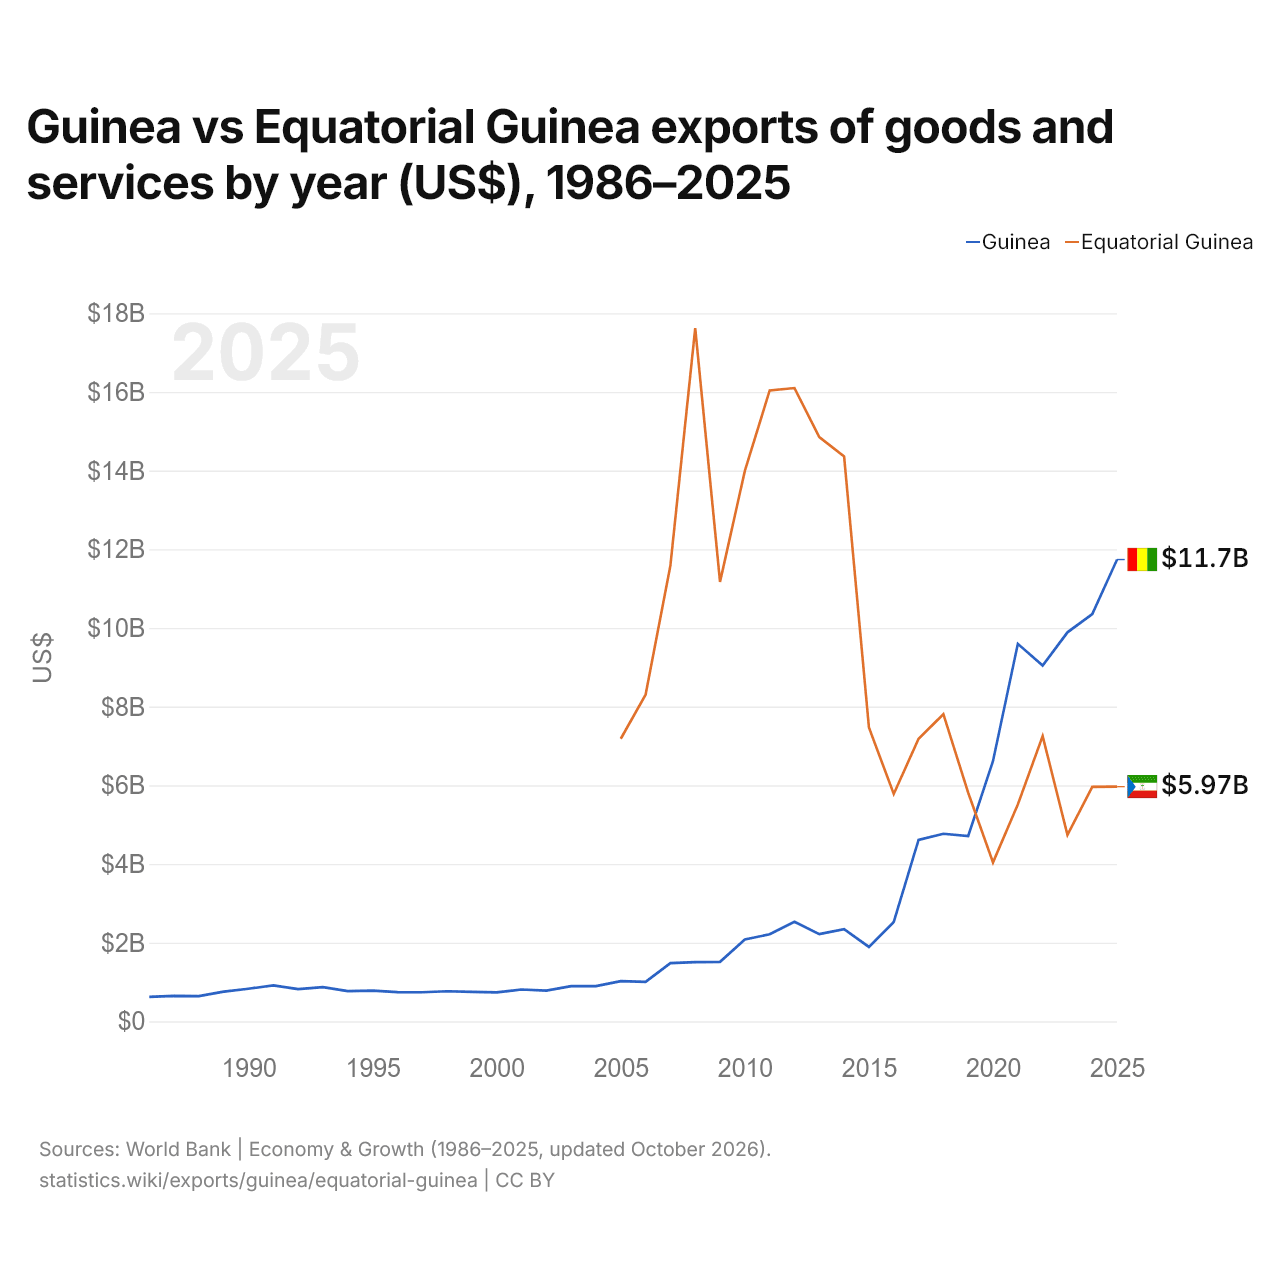
En 2025, las exportaciones de bienes y servicios de Guinea fueron de 11,7 mil millones de US$ y las de Guinea Ecuatorial, de 5,97 mil millones de US$: las de Guinea fueron 2,0 veces mayores. En 2005, las exportaciones de Guinea Ecuatorial fueron 7,0 veces mayores: 1,02 mil millones de US$ de Guinea y 7,18 mil millones de US$ de Guinea Ecuatorial.
Las exportaciones de bienes y servicios de Guinea han sido mayores que las de Guinea Ecuatorial todos los años desde 2020.
Exportaciones de bienes entre Guinea y Guinea Ecuatorial, según declara el exportador (US$)
| Año | US$ | |
|---|---|---|
| Guinea → Guinea [...] | Guinea [...] → Guinea | |
| 2016 | 5.000 US$ | - |
| 2015 | 90.000 US$ | 20.000 US$ |
| 2014 | 419.000 US$ | 3.000 US$ |
| 2013 | 6.252.000 US$ | 96.000 US$ |
| 2012 | 77.000 US$ | - |
| 2011 | 28.000 US$ | 498.000 US$ |
| 2010 | 244.000 US$ | - |
| 2009 | 4.000 US$ | - |
| 2008 | - | 585.000 US$ |
| 2007 | - | - |
| 2006 | 2.000 US$ | - |
| 2005 | 29.000 US$ | 1.529.000 US$ |
| 2004 | 123.000 US$ | 35.000 US$ |
| 2003 | - | 76.000 US$ |
| 2002 | - | 76.000 US$ |
| 2001 | 33.000 US$ | 1.000 US$ |
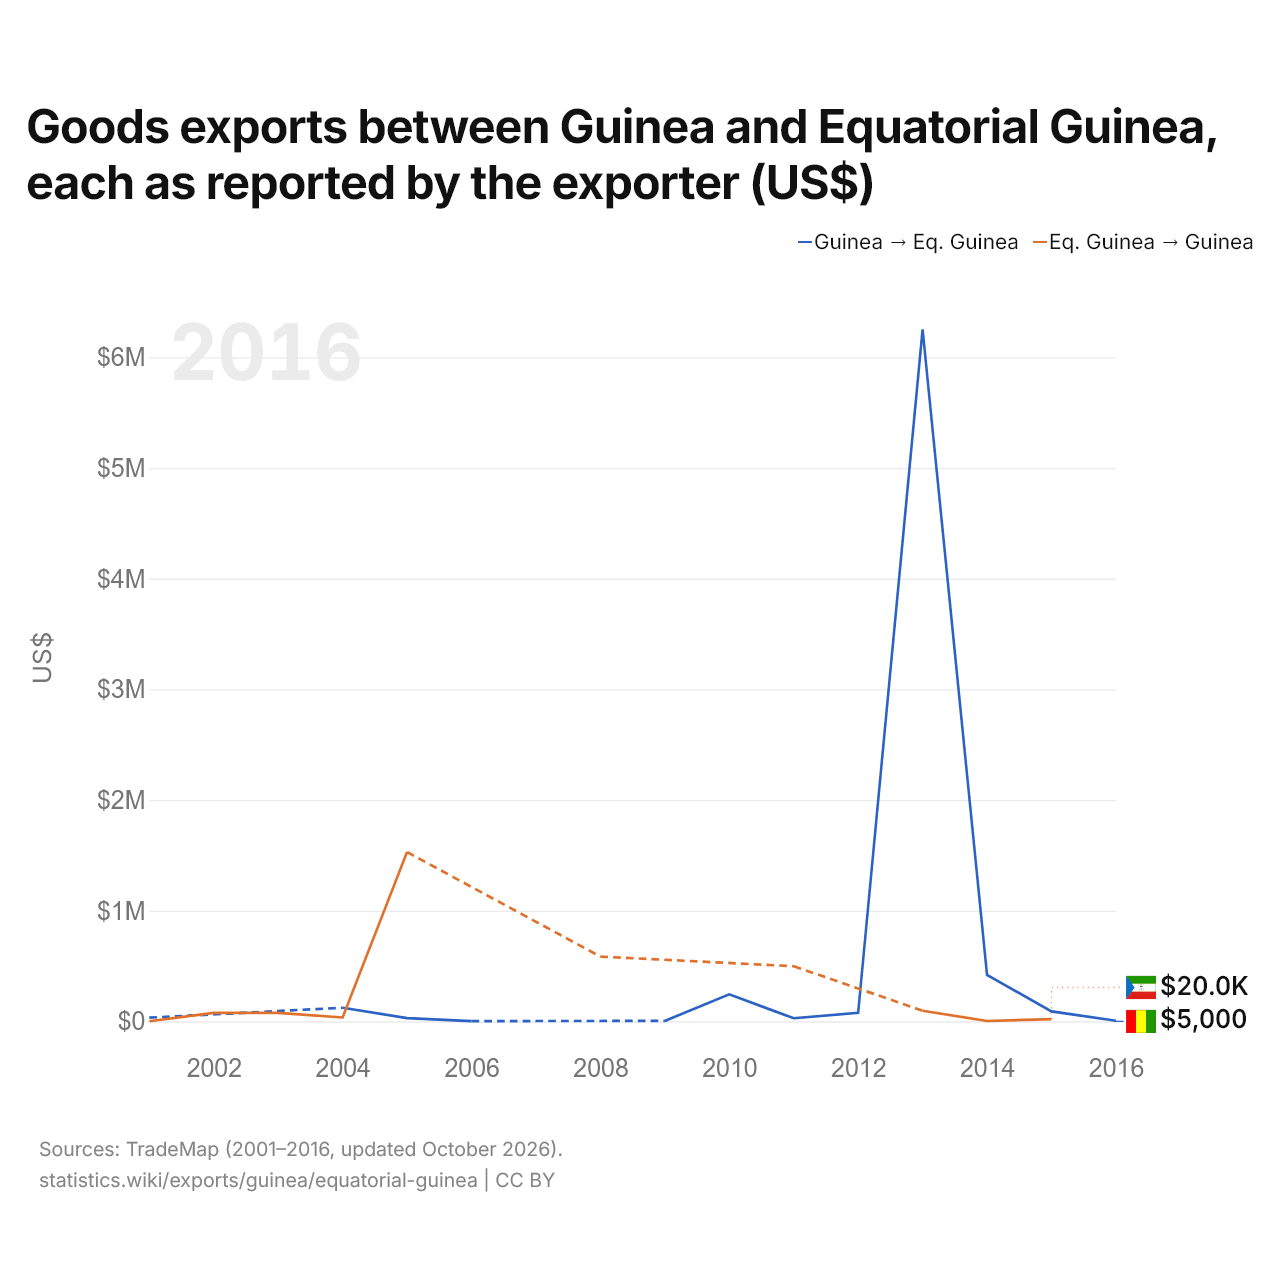
Las exportaciones de bienes de Guinea hacia Guinea Ecuatorial, según Guinea, fueron de 90.000 US$, y las de Guinea Ecuatorial hacia Guinea, según Guinea Ecuatorial, de 20.000 US$: 4,5 veces más desde Guinea. En 2001, fueron de 33.000 US$ desde Guinea y de 1000 US$ desde Guinea Ecuatorial.
Guinea vs Guinea Ecuatorial: cifras de exportaciones
|
Guinea
|
Guinea Ecuatorial
|
|
|---|---|---|
| Exportaciones | 11,7 mil M US$ (2025) | 5970 M US$ (2025) |
| Puesto mundial | 108/176 | 131/176 |
| Porcentaje del mundo | 0,03 % | 0,02 % |
| % del PIB | 41,4 % | 46,5 % |
| Mayor categoría de bienes | Metales preciosos, piedras preciosas, joyería, relojes, instrumentos musicales y arte (65,3 %, 2016) | Petróleo, gas, minerales y otras materias primas (93,2 %, 2025) |
| Principal destino de bienes | Emiratos Árabes Unidos (27,6 %, 2016) | China (24,4 %, 2025) |
Comparar las exportaciones de 2 países cualesquiera
Fuentes:
- Banco Mundial | Economía y crecimiento (1986–2025, actualizado en octubre de 2026)
- TradeMap (2001–2025, actualizado en octubre de 2026)
Creative Commons Atribución (CC BY): puedes copiar, compartir, adaptar y reutilizar este contenido, también con fines comerciales, siempre que cites a statistics.wiki e indiques los cambios que hayas hecho. Las fuentes indicadas arriba pueden tener sus propias condiciones de licencia.