
Guinea Ecuatorial vs Argentina: exportaciones de servicios de TI y de propiedad intelectual, 2000–2025 (incluye telecomunicaciones)
| Año | Exportaciones | |
|---|---|---|
 Guinea Ecuatorial |
 Argentina |
|
| 2025 | - | 3.165.570.000 US$ |
| 2024 | 0 US$ | 2.987.350.000 US$ |
| 2023 | 3.822.000 US$ | 2.872.430.000 US$ |
| 2022 | 3.434.000 US$ | 2.969.130.000 US$ |
| 2021 | 17.559.000 US$ | 2.606.030.000 US$ |
| 2020 | 6.558.000 US$ | 2.201.930.000 US$ |
| 2019 | 7.620.000 US$ | 2.374.872.000 US$ |
| 2018 | 7.769.000 US$ | 2.561.301.000 US$ |
| 2017 | 4.924.000 US$ | 2.584.186.000 US$ |
| 2016 | 1.527.000 US$ | 1.802.980.000 US$ |
| 2015 | 2.718.000 US$ | 1.635.243.000 US$ |
| 2014 | 1.683.000 US$ | 1.617.670.000 US$ |
| 2013 | 3.493.000 US$ | 300.144.000 US$ |
| 2012 | 3.038.000 US$ | 361.576.000 US$ |
| 2011 | 1.250.000 US$ | 418.068.000 US$ |
| 2010 | 2.379.000 US$ | 385.463.000 US$ |
| 2009 | 0 US$ | 334.022.000 US$ |
| 2008 | 0 US$ | 371.841.000 US$ |
| 2007 | 0 US$ | 343.270.000 US$ |
| 2006 | 0 US$ | 275.220.000 US$ |
| 2005 | 0 US$ | 221.030.000 US$ |
| 2004 | 0 US$ | 185.299.000 US$ |
| 2003 | 0 US$ | 173.090.000 US$ |
| 2002 | 0 US$ | 148.980.000 US$ |
| 2001 | 0 US$ | 176.775.000 US$ |
| 2000 | 0 US$ | 175.657.000 US$ |
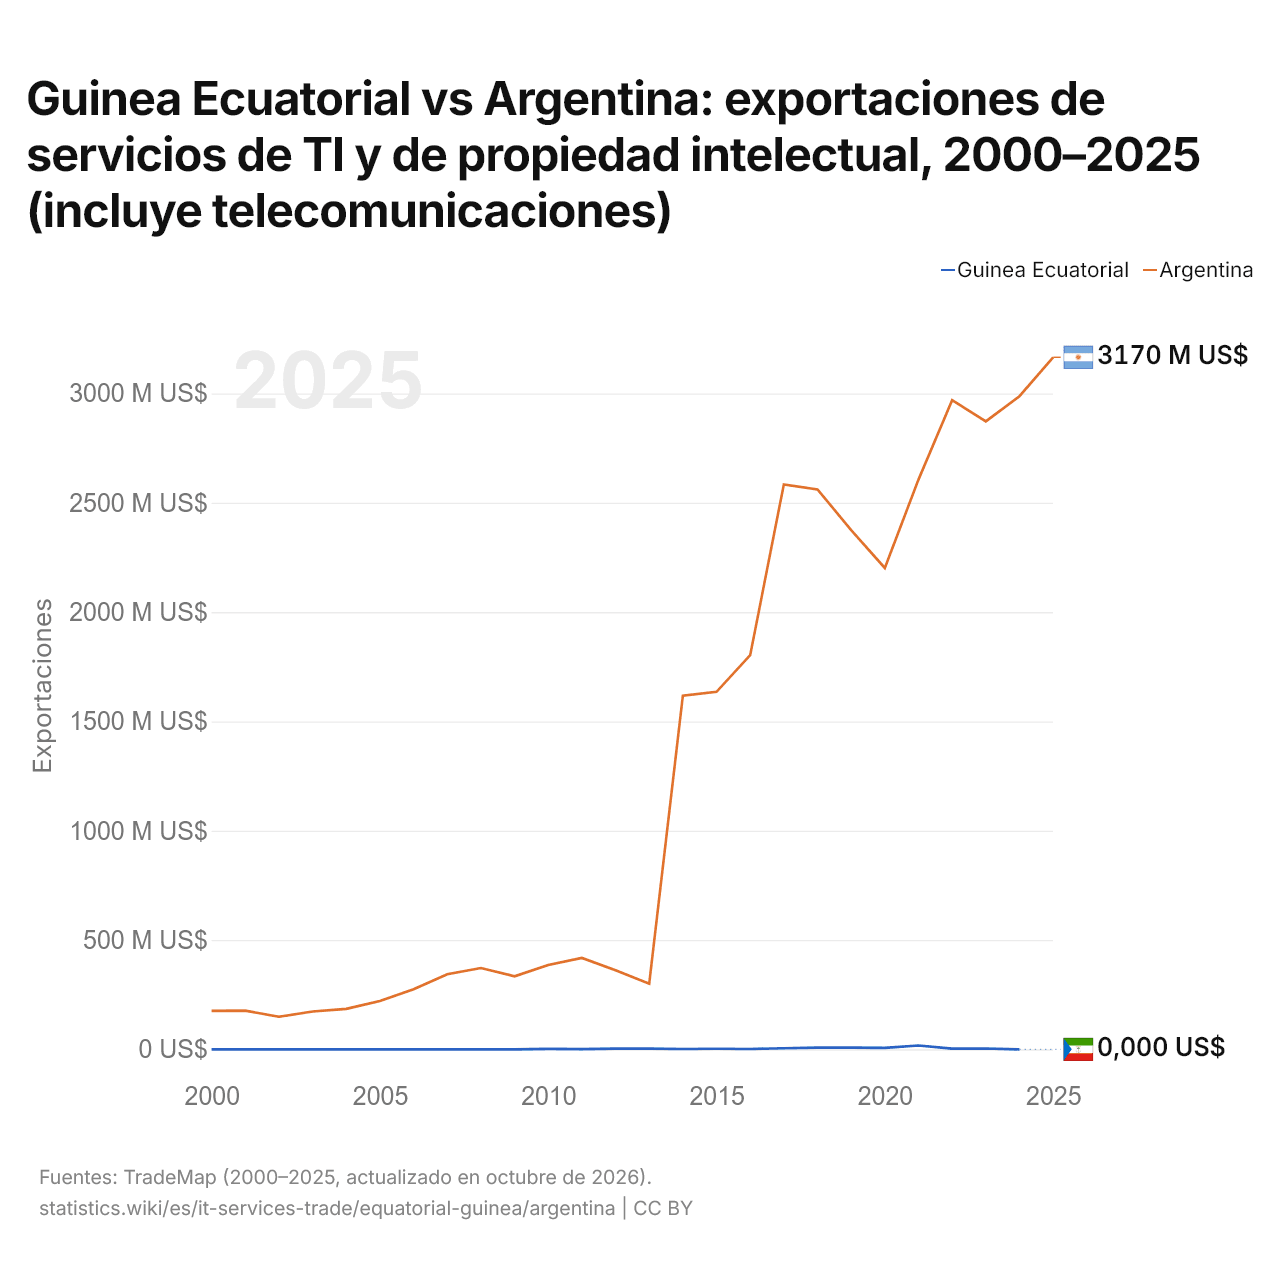
Las exportaciones de servicios de TI y de propiedad intelectual de Guinea Ecuatorial fueron de 0 US$ (2024) y las de Argentina, de 2,99 mil millones de US$ (2024). En 2000, las exportaciones fueron de 0 US$ de Guinea Ecuatorial y de 176 millones de US$ de Argentina.
Las exportaciones de servicios de TI y de propiedad intelectual de Argentina han sido mayores que las de Guinea Ecuatorial todos los años desde 2010.
Guinea Ecuatorial vs Argentina: importaciones de servicios de TI y de propiedad intelectual, 2000–2025
| Año | Importaciones | |
|---|---|---|
|
Guinea Ecuatorial
|
Argentina
|
|
| 2025 | - | 4.418.380.000 US$ |
| 2024 | 0 US$ | 4.335.790.000 US$ |
| 2023 | 30.109.000 US$ | 4.055.020.000 US$ |
| 2022 | 21.503.000 US$ | 3.632.560.000 US$ |
| 2021 | 19.293.000 US$ | 3.376.030.000 US$ |
| 2020 | 28.601.000 US$ | 2.681.319.000 US$ |
| 2019 | 34.706.000 US$ | 3.111.651.000 US$ |
| 2018 | 54.426.000 US$ | 3.459.296.000 US$ |
| 2017 | 36.434.000 US$ | 3.728.568.000 US$ |
| 2016 | 31.260.000 US$ | 3.208.304.000 US$ |
| 2015 | 31.867.000 US$ | 3.267.094.000 US$ |
| 2014 | 44.593.000 US$ | 3.350.651.000 US$ |
| 2013 | 25.096.000 US$ | 2.846.831.000 US$ |
| 2012 | 21.083.000 US$ | 2.489.887.000 US$ |
| 2011 | 20.108.000 US$ | 2.363.029.000 US$ |
| 2010 | 8.996.000 US$ | 1.955.128.000 US$ |
| 2009 | 0 US$ | 1.792.294.000 US$ |
| 2008 | 0 US$ | 1.835.210.000 US$ |
| 2007 | 0 US$ | 1.352.160.000 US$ |
| 2006 | 0 US$ | 1.070.030.000 US$ |
| 2005 | 0 US$ | 889.244.000 US$ |
| 2004 | 0 US$ | 717.920.000 US$ |
| 2003 | 0 US$ | 603.951.000 US$ |
| 2002 | 0 US$ | 547.798.000 US$ |
| 2001 | 0 US$ | 766.438.000 US$ |
| 2000 | 0 US$ | 755.138.000 US$ |
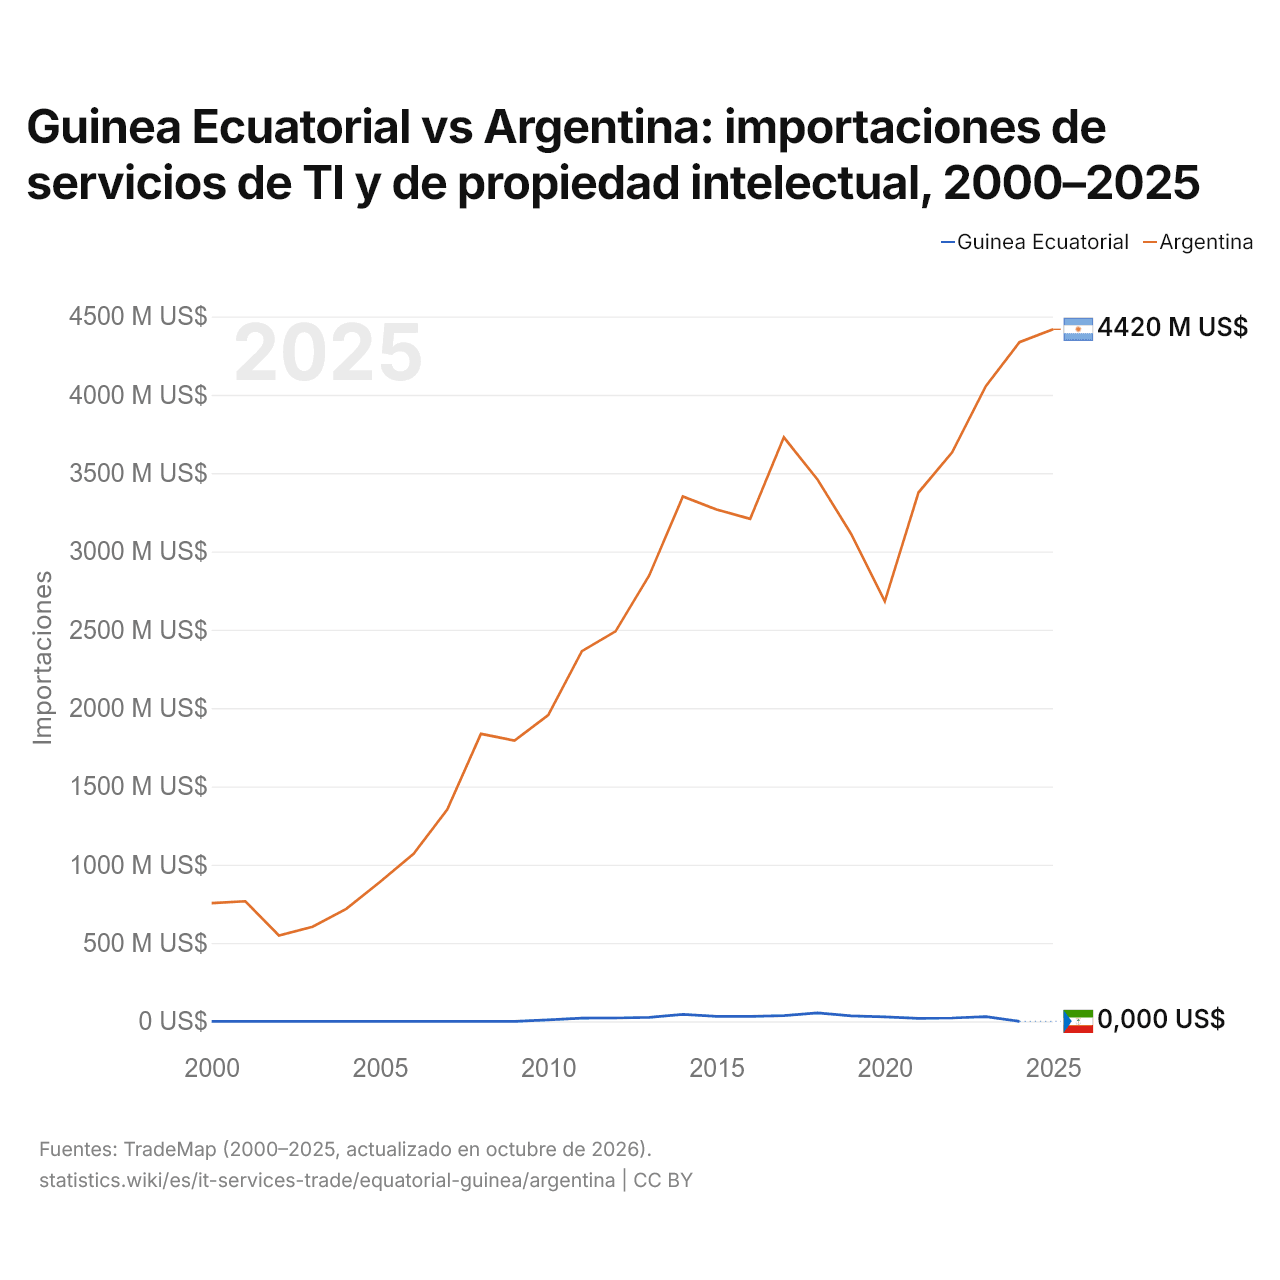
Las importaciones de servicios de TI y de propiedad intelectual de Guinea Ecuatorial fueron de 0 US$ (2024) y las de Argentina, de 4,34 mil millones de US$ (2024). En 2000, las importaciones fueron de 0 US$ de Guinea Ecuatorial y de 755 millones de US$ de Argentina.
Guinea Ecuatorial vs Argentina: cifras del comercio de servicios de TI y de propiedad intelectual
|
Guinea Ecuatorial
|
Argentina
|
|
|---|---|---|
| Exportaciones | 0 US$ (2024) | 3170 M US$ (2025) |
| Importaciones | 0 US$ (2024) | 4420 M US$ (2025) |
| Saldo | +0 US$ (2024) | −1250 M US$ (2025) |
| Porcentaje del mundo | 0 % | 0,16 % |
| Puesto mundial | 175/179 | 46/179 |
| Principal comprador | n/d | n/d |
| Principal proveedor | n/d | n/d |
Comparar el comercio de servicios de TI y de propiedad intelectual de 2 países cualesquiera
Fuentes:
- TradeMap (2000–2025, actualizado en octubre de 2026)
Creative Commons Atribución (CC BY): puedes copiar, compartir, adaptar y reutilizar este contenido, también con fines comerciales, siempre que cites a statistics.wiki e indiques los cambios que hayas hecho. Las fuentes indicadas arriba pueden tener sus propias condiciones de licencia.