
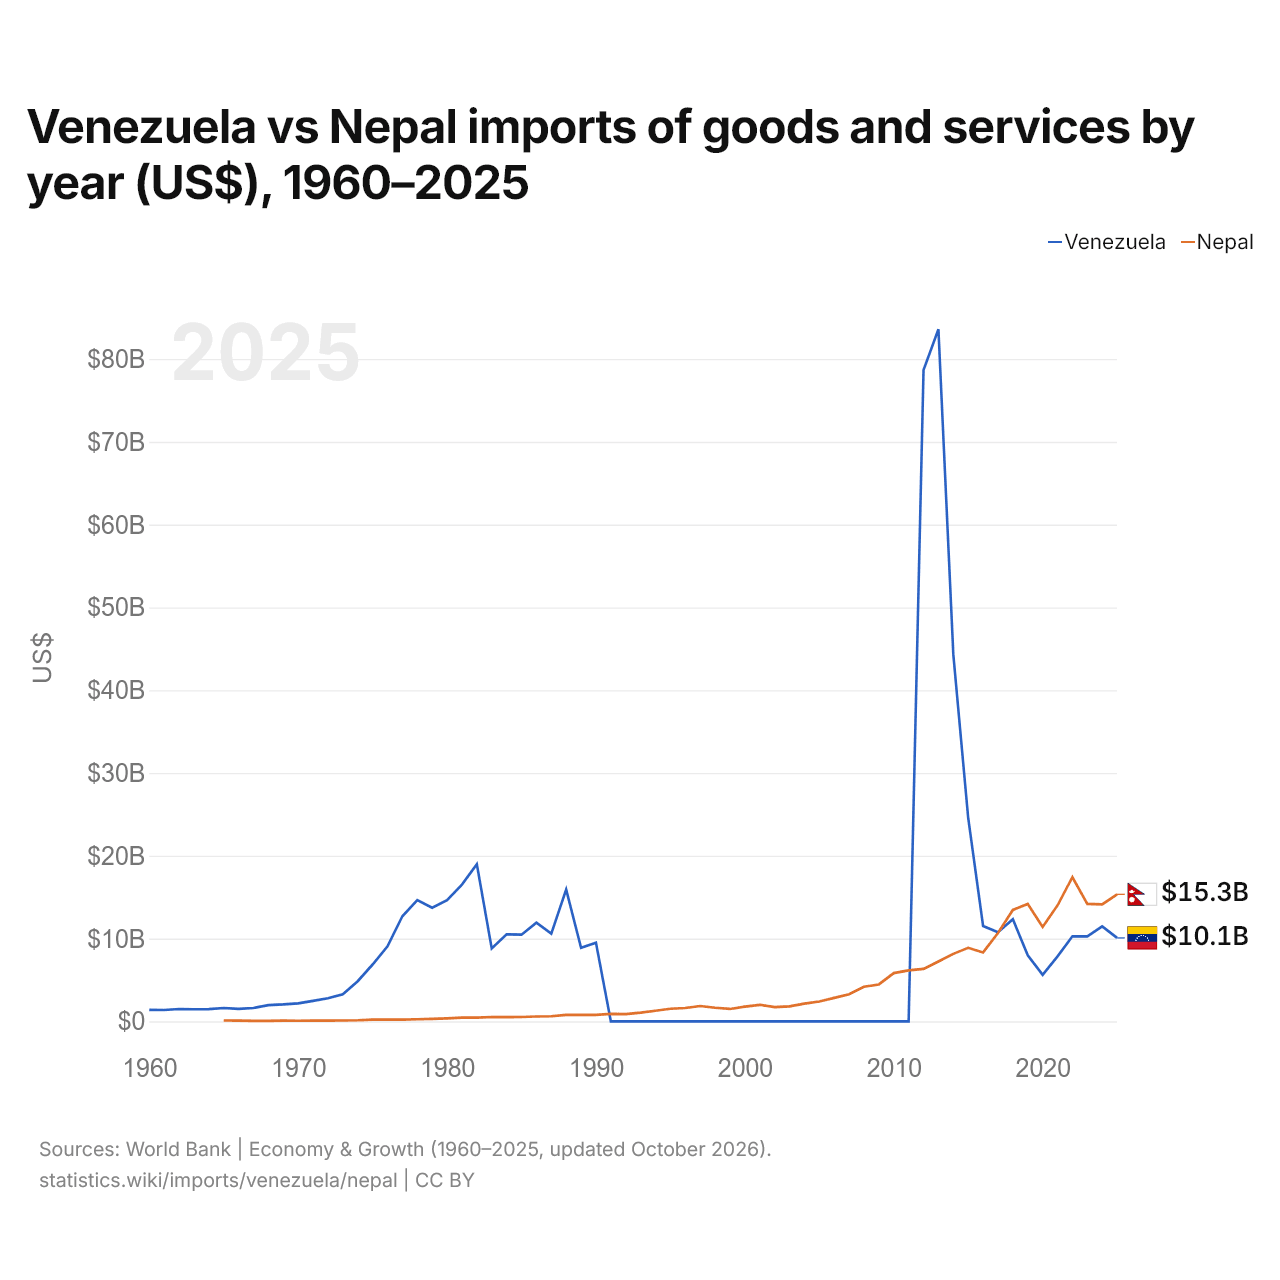
Venezuela vs Nepal: importaciones de bienes y servicios por año (US$), 1960–2025
| Año | US$ | |
|---|---|---|
 Venezuela |
 Nepal |
|
| 2025 | 10.074.121.350 US$ | 15.341.170.694 US$ |
| 2024 | 11.456.619.839 US$ | 14.122.276.350 US$ |
| 2023 | 10.266.483.009 US$ | 14.188.365.495 US$ |
| 2022 | 10.280.104.687 US$ | 17.408.444.736 US$ |
| 2021 | 7.856.090.324 US$ | 14.007.303.182 US$ |
| 2020 | 5.605.400.729 US$ | 11.405.416.698 US$ |
| 2019 | 7.982.721.069 US$ | 14.176.869.011 US$ |
| 2018 | 12.326.332.795 US$ | 13.453.790.806 US$ |
| 2017 | 10.756.686.685 US$ | 10.670.300.514 US$ |
| 2016 | 11.515.036.488 US$ | 8.322.479.252 US$ |
| 2015 | 24.577.347.081 US$ | 8.879.790.220 US$ |
| 2014 | 44.352.366.681 US$ | 8.151.238.036 US$ |
| 2013 | 83.592.737.983 US$ | 7.218.389.060 US$ |
| 2012 | 78.668.126.778 US$ | 6.331.144.981 US$ |
| 2011 | 0 US$ | 6.146.530.703 US$ |
| 2010 | 0 US$ | 5.825.346.141 US$ |
| 2009 | 0 US$ | 4.455.549.991 US$ |
| 2008 | 0 US$ | 4.172.661.317 US$ |
| 2007 | 0 US$ | 3.275.658.805 US$ |
| 2006 | 0 US$ | 2.832.075.349 US$ |
| 2005 | 0 US$ | 2.396.740.062 US$ |
| 2004 | 0 US$ | 2.143.236.207 US$ |
| 2003 | 0 US$ | 1.807.224.670 US$ |
| 2002 | 0 US$ | 1.724.111.682 US$ |
| 2001 | 0 US$ | 1.996.693.878 US$ |
| 2000 | 0 US$ | 1.781.598.378 US$ |
| 1999 | 0 US$ | 1.495.923.473 US$ |
| 1998 | 0 US$ | 1.645.665.860 US$ |
| 1997 | 0 US$ | 1.854.725.583 US$ |
| 1996 | 0 US$ | 1.611.500.000 US$ |
| 1995 | 0 US$ | 1.519.145.030 US$ |
| 1994 | 0 US$ | 1.278.518.367 US$ |
| 1993 | 0 US$ | 1.052.504.167 US$ |
| 1992 | 0 US$ | 875.325.167 US$ |
| 1991 | 0 US$ | 909.166.931 US$ |
| 1990 | 9.493.861.738 US$ | 785.781.967 US$ |
| 1989 | 8.884.312.275 US$ | 785.537.464 US$ |
| 1988 | 15.910.262.069 US$ | 780.457.946 US$ |
| 1987 | 10.598.117.241 US$ | 618.261.969 US$ |
| 1986 | 11.927.109.278 US$ | 578.786.926 US$ |
| 1985 | 10.466.520.000 US$ | 523.971.555 US$ |
| 1984 | 10.508.123.515 US$ | 502.021.599 US$ |
| 1983 | 8.799.209.302 US$ | 521.619.390 US$ |
| 1982 | 18.971.186.047 US$ | 450.514.044 US$ |
| 1981 | 16.518.209.302 US$ | 446.416.683 US$ |
| 1980 | 14.627.837.209 US$ | 364.500.008 US$ |
| 1979 | 13.727.674.419 US$ | 295.583.342 US$ |
| 1978 | 14.650.348.837 US$ | 248.201.285 US$ |
| 1977 | 12.692.465.116 US$ | 197.919.992 US$ |
| 1976 | 9.069.255.814 US$ | 205.966.282 US$ |
| 1975 | 6.863.837.209 US$ | 210.631.428 US$ |
| 1974 | 4.838.441.860 US$ | 128.470.911 US$ |
| 1973 | 3.263.139.535 US$ | 100.827.881 US$ |
| 1972 | 2.793.090.909 US$ | 81.086.388 US$ |
| 1971 | 2.463.204.545 US$ | 80.592.593 US$ |
| 1970 | 2.171.911.111 US$ | 71.901.235 US$ |
| 1969 | 2.042.888.889 US$ | 80.592.593 US$ |
| 1968 | 1.956.888.889 US$ | 57.920.044 US$ |
| 1967 | 1.612.822.222 US$ | 58.537.866 US$ |
| 1966 | 1.505.288.889 US$ | 79.406.746 US$ |
| 1965 | 1.612.822.222 US$ | 102.375.640 US$ |
| 1964 | 1.473.655.172 US$ | - |
| 1963 | 1.458.861.579 US$ | - |
| 1962 | 1.489.969.152 US$ | - |
| 1961 | 1.366.605.304 US$ | - |
| 1960 | 1.390.889.415 US$ | - |
En 2025, las importaciones de bienes y servicios de Venezuela fueron de 10,1 mil millones de US$ y las de Nepal, de 15,3 mil millones de US$: las de Nepal fueron 1,5 veces mayores. En 1965, las importaciones de Venezuela fueron 16 veces mayores: 1,61 mil millones de US$ de Venezuela y 102 millones de US$ de Nepal.
Las importaciones de bienes y servicios de Nepal han sido mayores que las de Venezuela todos los años desde 2018.
Venezuela vs Nepal: cifras de importaciones
|
Venezuela
|
Nepal
|
|
|---|---|---|
| Importaciones | 10,1 mil M US$ (2025) | 15,3 mil M US$ (2025) |
| Puesto mundial | 118/174 | 102/174 |
| Porcentaje del mundo | 0,03 % | 0,05 % |
| % del PIB | 10,1 % | 33,7 % |
| Mayor categoría de bienes | n/d | Petróleo, gas, minerales y otras materias primas (26,9 %, 2022) |
| Principal origen de bienes | n/d | India (63,2 %, 2022) |
Comparar las importaciones de 2 países cualesquiera
Fuentes:
- Banco Mundial | Economía y crecimiento (1960–2025, actualizado en octubre de 2026)
- TradeMap (2009–2022, actualizado en octubre de 2026)
Creative Commons Atribución (CC BY): puedes copiar, compartir, adaptar y reutilizar este contenido, también con fines comerciales, siempre que cites a statistics.wiki e indiques los cambios que hayas hecho. Las fuentes indicadas arriba pueden tener sus propias condiciones de licencia.