
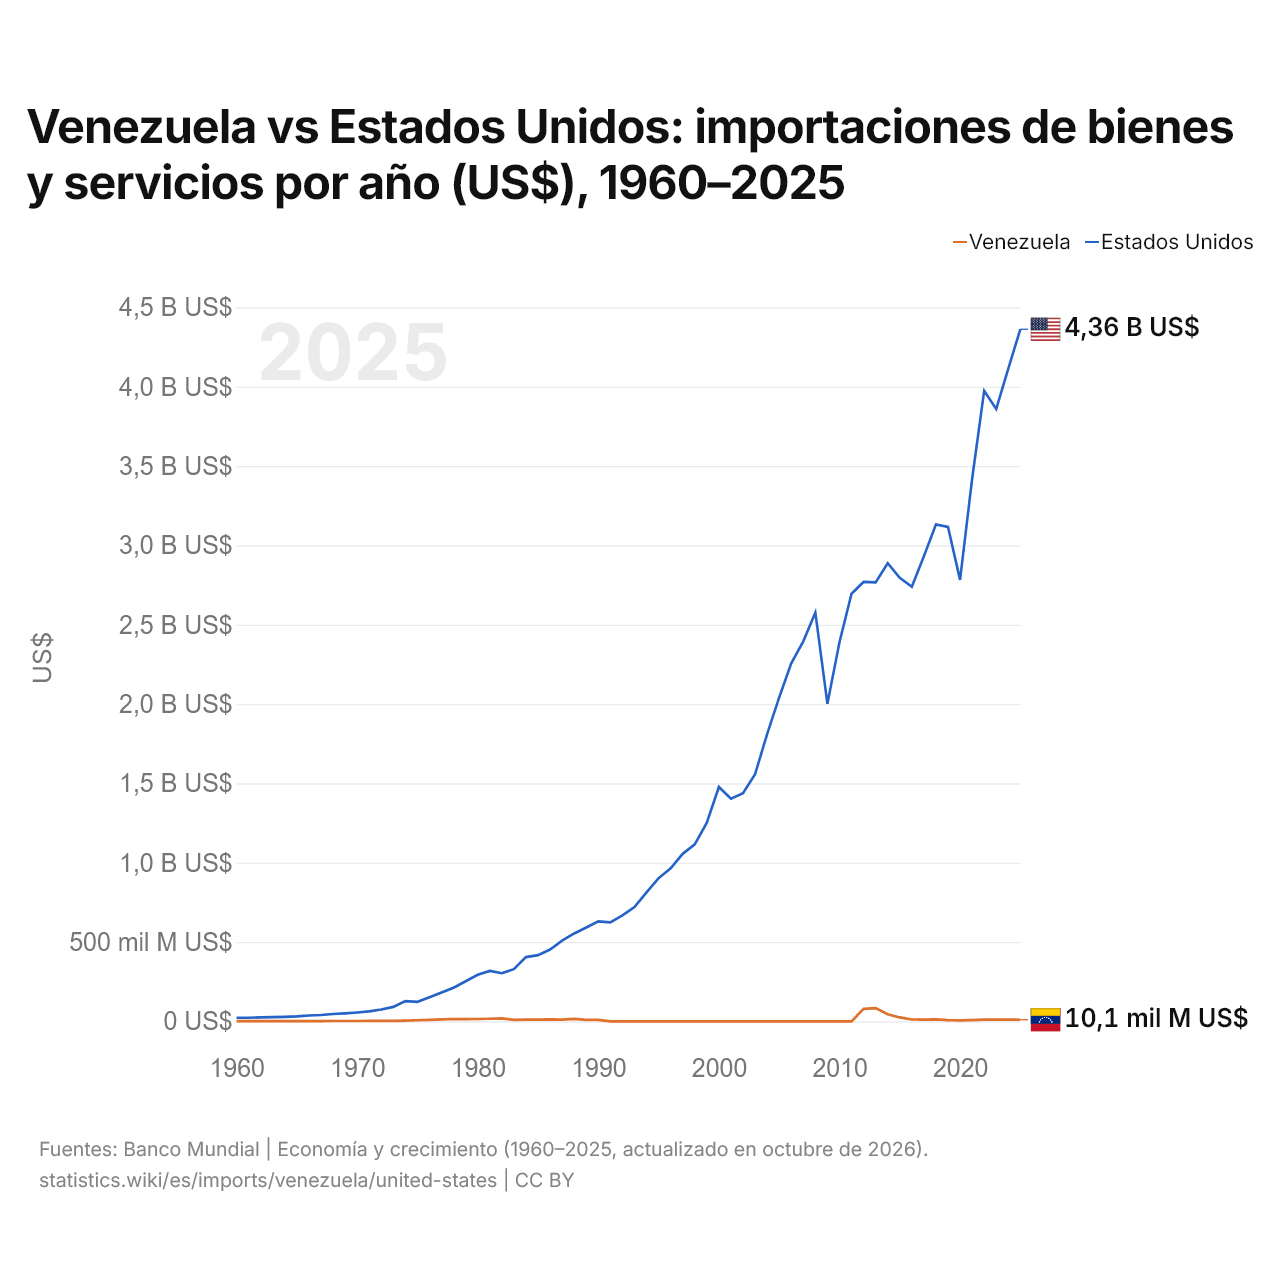
Venezuela vs Estados Unidos: importaciones de bienes y servicios por año (US$), 1960–2025
1x
| Año | US$ | |
|---|---|---|
 Venezuela |
 Estados Unidos |
|
| 2025 | 10.074.121.350 US$ | 4.361.777.000.000 US$ |
| 2024 | 11.456.619.839 US$ | 4.113.828.000.000 US$ |
| 2023 | 10.266.483.009 US$ | 3.859.856.000.000 US$ |
| 2022 | 10.280.104.687 US$ | 3.974.319.000.000 US$ |
| 2021 | 7.856.090.324 US$ | 3.417.930.000.000 US$ |
| 2020 | 5.605.400.729 US$ | 2.782.391.000.000 US$ |
| 2019 | 7.982.721.069 US$ | 3.116.681.000.000 US$ |
| 2018 | 12.326.332.795 US$ | 3.131.166.000.000 US$ |
| 2017 | 10.756.686.685 US$ | 2.931.589.000.000 US$ |
| 2016 | 11.515.036.488 US$ | 2.738.830.000.000 US$ |
| 2015 | 24.577.347.081 US$ | 2.794.942.000.000 US$ |
| 2014 | 44.352.366.681 US$ | 2.887.445.000.000 US$ |
| 2013 | 83.592.737.983 US$ | 2.766.375.000.000 US$ |
| 2012 | 78.668.126.778 US$ | 2.769.317.000.000 US$ |
| 2011 | 0 US$ | 2.695.480.000.000 US$ |
| 2010 | 0 US$ | 2.389.555.000.000 US$ |
| 2009 | 0 US$ | 2.001.927.000.000 US$ |
| 2008 | 0 US$ | 2.576.151.000.000 US$ |
| 2007 | 0 US$ | 2.395.228.000.000 US$ |
| 2006 | 0 US$ | 2.256.623.000.000 US$ |
| 2005 | 0 US$ | 2.041.482.000.000 US$ |
| 2004 | 0 US$ | 1.810.504.000.000 US$ |
| 2003 | 0 US$ | 1.557.120.000.000 US$ |
| 2002 | 0 US$ | 1.437.724.000.000 US$ |
| 2001 | 0 US$ | 1.403.559.000.000 US$ |
| 2000 | 0 US$ | 1.477.184.000.000 US$ |
| 1999 | 0 US$ | 1.252.460.000.000 US$ |
| 1998 | 0 US$ | 1.115.690.000.000 US$ |
| 1997 | 0 US$ | 1.055.774.000.000 US$ |
| 1996 | 0 US$ | 963.966.000.000 US$ |
| 1995 | 0 US$ | 902.572.000.000 US$ |
| 1994 | 0 US$ | 813.424.000.000 US$ |
| 1993 | 0 US$ | 719.973.000.000 US$ |
| 1992 | 0 US$ | 667.791.000.000 US$ |
| 1991 | 0 US$ | 623.544.000.000 US$ |
| 1990 | 9.493.861.738 US$ | 629.728.000.000 US$ |
| 1989 | 8.884.312.275 US$ | 591.030.000.000 US$ |
| 1988 | 15.910.262.069 US$ | 553.993.000.000 US$ |
| 1987 | 10.598.117.241 US$ | 508.713.000.000 US$ |
| 1986 | 11.927.109.278 US$ | 452.867.000.000 US$ |
| 1985 | 10.466.520.000 US$ | 417.229.000.000 US$ |
| 1984 | 10.508.123.515 US$ | 405.107.000.000 US$ |
| 1983 | 8.799.209.302 US$ | 328.638.000.000 US$ |
| 1982 | 18.971.186.047 US$ | 303.184.000.000 US$ |
| 1981 | 16.518.209.302 US$ | 317.758.000.000 US$ |
| 1980 | 14.627.837.209 US$ | 293.828.000.000 US$ |
| 1979 | 13.727.674.419 US$ | 252.674.000.000 US$ |
| 1978 | 14.650.348.837 US$ | 212.250.000.000 US$ |
| 1977 | 12.692.465.116 US$ | 182.443.000.000 US$ |
| 1976 | 9.069.255.814 US$ | 151.146.000.000 US$ |
| 1975 | 6.863.837.209 US$ | 122.730.000.000 US$ |
| 1974 | 4.838.441.860 US$ | 127.465.000.000 US$ |
| 1973 | 3.263.139.535 US$ | 91.159.000.000 US$ |
| 1972 | 2.793.090.909 US$ | 74.216.000.000 US$ |
| 1971 | 2.463.204.545 US$ | 62.342.000.000 US$ |
| 1970 | 2.171.911.111 US$ | 55.760.000.000 US$ |
| 1969 | 2.042.888.889 US$ | 50.439.790.647 US$ |
| 1968 | 1.956.888.889 US$ | 46.486.084.810 US$ |
| 1967 | 1.612.822.222 US$ | 39.860.199.662 US$ |
| 1966 | 1.505.288.889 US$ | 37.009.236.566 US$ |
| 1965 | 1.612.822.222 US$ | 31.461.196.297 US$ |
| 1964 | 1.473.655.172 US$ | 28.043.049.184 US$ |
| 1963 | 1.458.861.579 US$ | 26.080.864.402 US$ |
| 1962 | 1.489.969.152 US$ | 24.919.992.127 US$ |
| 1961 | 1.366.605.304 US$ | 22.659.754.237 US$ |
| 1960 | 1.390.889.415 US$ | 22.824.075.764 US$ |
En 2025, las importaciones de bienes y servicios de Venezuela fueron de 10,1 mil millones de US$ y las de Estados Unidos, de 4,36 billones de US$: las de Estados Unidos fueron 430 veces mayores. En 1960, las importaciones de Estados Unidos fueron 16 veces mayores: 1,39 mil millones de US$ de Venezuela y 22,8 mil millones de US$ de Estados Unidos.
Venezuela vs Estados Unidos: cifras de importaciones
|
Venezuela
|
Estados Unidos
|
|
|---|---|---|
| Importaciones | 10,1 mil M US$ (2025) | 4,36 B US$ (2025) |
| Puesto mundial | 118/174 | 1/174 |
| Porcentaje del mundo | 0,03 % | 12,9 % |
| % del PIB | 10,1 % | 14,2 % |
| Mayor categoría de bienes | n/d | Maquinaria, electrónica y vehículos (47,9 %, 2025) |
| Principal origen de bienes | n/d | México (15,4 %, 2025) |
Comparar las importaciones de 2 países cualesquiera
Fuentes:
- Banco Mundial | Economía y crecimiento (1960–2025, actualizado en octubre de 2026)
- TradeMap (2001–2025, actualizado en octubre de 2026)
Creative Commons Atribución (CC BY): puedes copiar, compartir, adaptar y reutilizar este contenido, también con fines comerciales, siempre que cites a statistics.wiki e indiques los cambios que hayas hecho. Las fuentes indicadas arriba pueden tener sus propias condiciones de licencia.