
Venezuela vs Nepal: PIB, 1960–2025
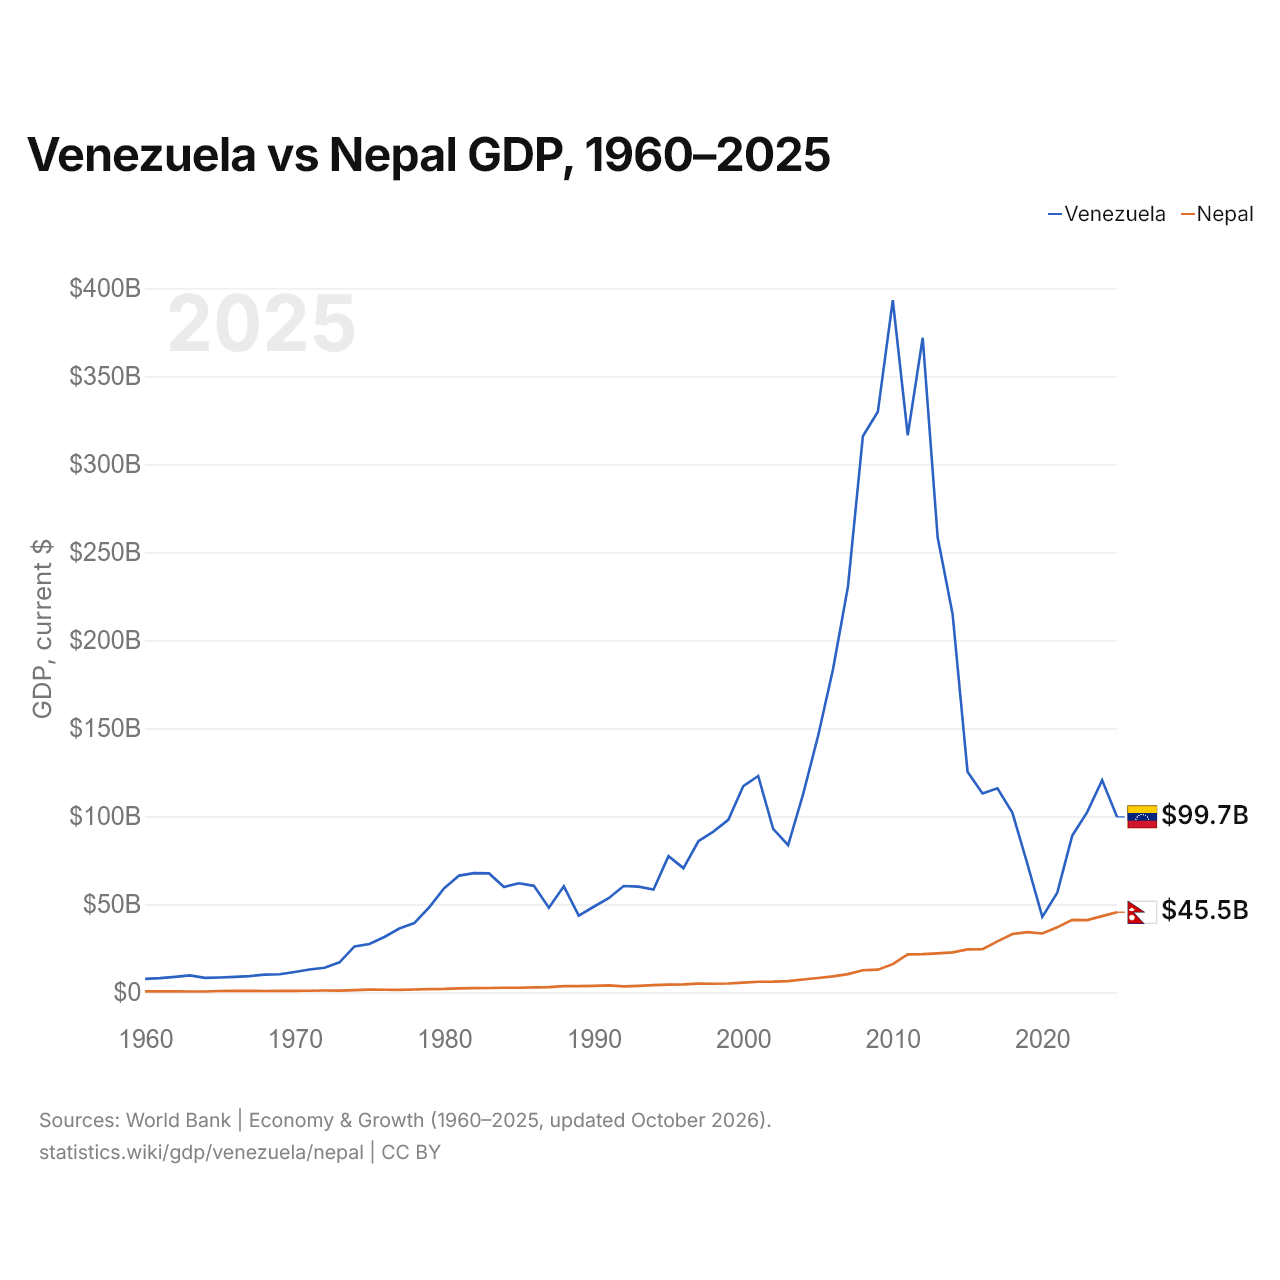
| Año | PIB, US$ corrientes | |
|---|---|---|
 Venezuela |
 Nepal |
|
| 2025 | 99.661.244.156 US$ | 45.489.810.283 US$ |
| 2024 | 120.566.112.397 US$ | 43.298.911.700 US$ |
| 2023 | 102.377.501.186 US$ | 41.049.329.851 US$ |
| 2022 | 89.013.251.021 US$ | 41.182.939.520 US$ |
| 2021 | 56.615.026.263 US$ | 36.924.841.394 US$ |
| 2020 | 42.837.965.907 US$ | 33.433.659.301 US$ |
| 2019 | 73.014.157.108 US$ | 34.186.180.699 US$ |
| 2018 | 101.987.075.929 US$ | 33.111.525.237 US$ |
| 2017 | 115.892.475.743 US$ | 28.971.588.940 US$ |
| 2016 | 112.948.035.495 US$ | 24.524.109.484 US$ |
| 2015 | 125.249.941.854 US$ | 24.360.801.287 US$ |
| 2014 | 214.838.755.022 US$ | 22.731.612.922 US$ |
| 2013 | 258.512.396.298 US$ | 22.162.204.925 US$ |
| 2012 | 371.846.610.182 US$ | 21.703.100.877 US$ |
| 2011 | 316.482.190.800 US$ | 21.573.872.421 US$ |
| 2010 | 393.192.354.511 US$ | 16.002.656.434 US$ |
| 2009 | 329.787.628.928 US$ | 12.854.985.464 US$ |
| 2008 | 315.953.388.511 US$ | 12.545.438.605 US$ |
| 2007 | 230.364.012.576 US$ | 10.325.618.017 US$ |
| 2006 | 183.477.522.124 US$ | 9.043.715.356 US$ |
| 2005 | 145.513.489.652 US$ | 8.130.258.378 US$ |
| 2004 | 112.451.400.425 US$ | 7.273.938.315 US$ |
| 2003 | 83.620.628.582 US$ | 6.330.473.097 US$ |
| 2002 | 92.893.587.734 US$ | 6.050.875.807 US$ |
| 2001 | 122.911.036.747 US$ | 6.007.055.042 US$ |
| 2000 | 117.146.466.003 US$ | 5.494.252.208 US$ |
| 1999 | 97.972.842.462 US$ | 5.033.642.384 US$ |
| 1998 | 91.336.763.255 US$ | 4.856.255.044 US$ |
| 1997 | 85.837.678.560 US$ | 4.918.691.917 US$ |
| 1996 | 70.543.211.119 US$ | 4.521.580.381 US$ |
| 1995 | 77.389.487.770 US$ | 4.401.104.418 US$ |
| 1994 | 58.418.666.667 US$ | 4.066.775.510 US$ |
| 1993 | 60.037.460.783 US$ | 3.660.041.667 US$ |
| 1992 | 60.416.519.620 US$ | 3.401.211.581 US$ |
| 1991 | 53.453.444.787 US$ | 3.921.476.085 US$ |
| 1990 | 48.606.952.195 US$ | 3.627.560.239 US$ |
| 1989 | 43.536.709.104 US$ | 3.525.225.787 US$ |
| 1988 | 60.226.413.793 US$ | 3.487.009.748 US$ |
| 1987 | 48.029.034.483 US$ | 2.957.255.380 US$ |
| 1986 | 60.516.123.711 US$ | 2.850.782.044 US$ |
| 1985 | 61.965.466.667 US$ | 2.619.913.956 US$ |
| 1984 | 59.867.743.468 US$ | 2.581.207.388 US$ |
| 1983 | 67.556.279.070 US$ | 2.447.174.803 US$ |
| 1982 | 67.736.744.186 US$ | 2.395.423.742 US$ |
| 1981 | 66.327.441.860 US$ | 2.275.583.317 US$ |
| 1980 | 59.116.511.628 US$ | 1.945.916.583 US$ |
| 1979 | 48.310.930.233 US$ | 1.851.250.008 US$ |
| 1978 | 39.316.279.070 US$ | 1.604.162.497 US$ |
| 1977 | 36.210.697.674 US$ | 1.382.400.000 US$ |
| 1976 | 31.419.534.884 US$ | 1.452.788.985 US$ |
| 1975 | 27.464.651.163 US$ | 1.575.789.254 US$ |
| 1974 | 26.100.930.233 US$ | 1.217.953.547 US$ |
| 1973 | 17.035.581.395 US$ | 972.101.725 US$ |
| 1972 | 13.977.727.273 US$ | 1.024.098.400 US$ |
| 1971 | 12.986.590.909 US$ | 882.765.472 US$ |
| 1970 | 11.561.111.111 US$ | 865.975.309 US$ |
| 1969 | 10.285.111.111 US$ | 788.641.965 US$ |
| 1968 | 10.034.444.444 US$ | 772.231.387 US$ |
| 1967 | 9.250.000.000 US$ | 841.974.025 US$ |
| 1966 | 8.781.333.333 US$ | 906.811.944 US$ |
| 1965 | 8.427.777.778 US$ | 735.267.082 US$ |
| 1964 | 8.192.413.793 US$ | 496.098.775 US$ |
| 1963 | 9.608.717.288 US$ | 496.947.904 US$ |
| 1962 | 8.814.309.884 US$ | 574.091.101 US$ |
| 1961 | 8.067.267.031 US$ | 531.959.562 US$ |
| 1960 | 7.663.938.303 US$ | 508.334.414 US$ |
En 2025, el PIB de Venezuela (99,7 mil millones de US$) fue 2,2 veces el de Nepal (45,5 mil millones de US$). En 2015 era 5,1 veces. De 2015 a 2025, a precios constantes de 2015, el PIB de Venezuela cayó un 65,4 %, mientras que el de Nepal creció un 50,0 %.
Desde 1960, el PIB de Venezuela ha sido cada año el mayor de los dos; en 1960, era 15 veces el de Nepal. En 2025, el PIB per cápita fue de 3495 US$ en Venezuela y de 1536 US$ en Nepal: 2,3 veces más alto en Venezuela.
Venezuela vs Nepal: últimos datos del PIB
|
Venezuela
|
Nepal
|
|
|---|---|---|
| PIB, US$ corrientes | 99,7 mil M US$ | 45,5 mil M US$ |
| Puesto mundial | 78/197 | 102/197 |
| Porcentaje del mundo | 0,08 % | 0,04 % |
| PIB, US$ constantes de 2015 | 43,3 mil M US$ | 36,5 mil M US$ |
| Diferencia de PIB | 2,2× | 0,46× |
Comparar el PIB de 2 países cualesquiera
Fuentes:
- Banco Mundial | Economía y crecimiento (1960–2025, actualizado en octubre de 2026)
Creative Commons Atribución (CC BY): puedes copiar, compartir, adaptar y reutilizar este contenido, también con fines comerciales, siempre que cites a statistics.wiki e indiques los cambios que hayas hecho. Las fuentes indicadas arriba pueden tener sus propias condiciones de licencia.