
Venezuela vs Haití: PIB, 1960–2025
| Año | PIB, US$ corrientes | |
|---|---|---|
 Venezuela |
 Haití |
|
| 2025 | 99.661.244.156 US$ | 32.077.278.409 US$ |
| 2024 | 120.566.112.397 US$ | 24.255.657.481 US$ |
| 2023 | 102.377.501.186 US$ | 19.572.288.894 US$ |
| 2022 | 89.013.251.021 US$ | 20.113.007.126 US$ |
| 2021 | 56.615.026.263 US$ | 20.754.978.152 US$ |
| 2020 | 42.837.965.907 US$ | 14.508.222.518 US$ |
| 2019 | 73.014.157.108 US$ | 15.016.090.930 US$ |
| 2018 | 101.987.075.929 US$ | 16.403.864.618 US$ |
| 2017 | 115.892.475.743 US$ | 15.093.357.161 US$ |
| 2016 | 112.948.035.495 US$ | 14.069.277.526 US$ |
| 2015 | 125.249.941.854 US$ | 14.849.629.309 US$ |
| 2014 | 214.838.755.022 US$ | 15.146.883.498 US$ |
| 2013 | 258.512.396.298 US$ | 14.902.488.604 US$ |
| 2012 | 371.846.610.182 US$ | 13.708.925.477 US$ |
| 2011 | 316.482.190.800 US$ | 13.008.746.039 US$ |
| 2010 | 393.192.354.511 US$ | 11.859.312.725 US$ |
| 2009 | 329.787.628.928 US$ | 11.597.002.835 US$ |
| 2008 | 315.953.388.511 US$ | 10.432.962.635 US$ |
| 2007 | 230.364.012.576 US$ | 9.228.637.768 US$ |
| 2006 | 183.477.522.124 US$ | 7.638.739.123 US$ |
| 2005 | 145.513.489.652 US$ | 7.030.149.730 US$ |
| 2004 | 112.451.400.425 US$ | 6.087.360.684 US$ |
| 2003 | 83.620.628.582 US$ | 5.071.947.798 US$ |
| 2002 | 92.893.587.734 US$ | 6.205.847.214 US$ |
| 2001 | 122.911.036.747 US$ | 6.331.970.324 US$ |
| 2000 | 117.146.466.003 US$ | 6.813.566.099 US$ |
| 1999 | 97.972.842.462 US$ | 4.153.725.884 US$ |
| 1998 | 91.336.763.255 US$ | 3.723.903.724 US$ |
| 1997 | 85.837.678.560 US$ | 3.338.949.152 US$ |
| 1996 | 70.543.211.119 US$ | 2.907.517.604 US$ |
| 1995 | 77.389.487.770 US$ | 2.813.313.279 US$ |
| 1994 | 58.418.666.667 US$ | 2.167.569.046 US$ |
| 1993 | 60.037.460.783 US$ | 1.878.253.767 US$ |
| 1992 | 60.416.519.620 US$ | 2.257.129.792 US$ |
| 1991 | 53.453.444.787 US$ | 3.473.562.628 US$ |
| 1990 | 48.606.952.195 US$ | 3.096.289.800 US$ |
| 1989 | 43.536.709.104 US$ | 2.736.243.800 US$ |
| 1988 | 60.226.413.793 US$ | 2.613.926.800 US$ |
| 1987 | 48.029.034.483 US$ | 2.047.200.000 US$ |
| 1986 | 60.516.123.711 US$ | 2.318.000.000 US$ |
| 1985 | 61.965.466.667 US$ | 2.009.400.000 US$ |
| 1984 | 59.867.743.468 US$ | 1.816.200.000 US$ |
| 1983 | 67.556.279.070 US$ | 1.623.600.000 US$ |
| 1982 | 67.736.744.186 US$ | 1.474.200.000 US$ |
| 1981 | 66.327.441.860 US$ | 1.479.400.000 US$ |
| 1980 | 59.116.511.628 US$ | 1.383.800.000 US$ |
| 1979 | 48.310.930.233 US$ | 1.080.600.000 US$ |
| 1978 | 39.316.279.070 US$ | 974.200.000 US$ |
| 1977 | 36.210.697.674 US$ | 947.000.000 US$ |
| 1976 | 31.419.534.884 US$ | 879.000.000 US$ |
| 1975 | 27.464.651.163 US$ | 681.400.000 US$ |
| 1974 | 26.100.930.233 US$ | 565.399.322 US$ |
| 1973 | 17.035.581.395 US$ | 466.798.973 US$ |
| 1972 | 13.977.727.273 US$ | 371.998.958 US$ |
| 1971 | 12.986.590.909 US$ | 362.800.000 US$ |
| 1970 | 11.561.111.111 US$ | 331.200.000 US$ |
| 1969 | 10.285.111.111 US$ | 391.820.400 US$ |
| 1968 | 10.034.444.444 US$ | 367.968.800 US$ |
| 1967 | 9.250.000.000 US$ | 369.124.200 US$ |
| 1966 | 8.781.333.333 US$ | 368.948.600 US$ |
| 1965 | 8.427.777.778 US$ | 353.251.800 US$ |
| 1964 | 8.192.413.793 US$ | 325.281.200 US$ |
| 1963 | 9.608.717.288 US$ | 294.883.400 US$ |
| 1962 | 8.814.309.884 US$ | 281.896.800 US$ |
| 1961 | 8.067.267.031 US$ | 271.066.000 US$ |
| 1960 | 7.663.938.303 US$ | 273.187.200 US$ |
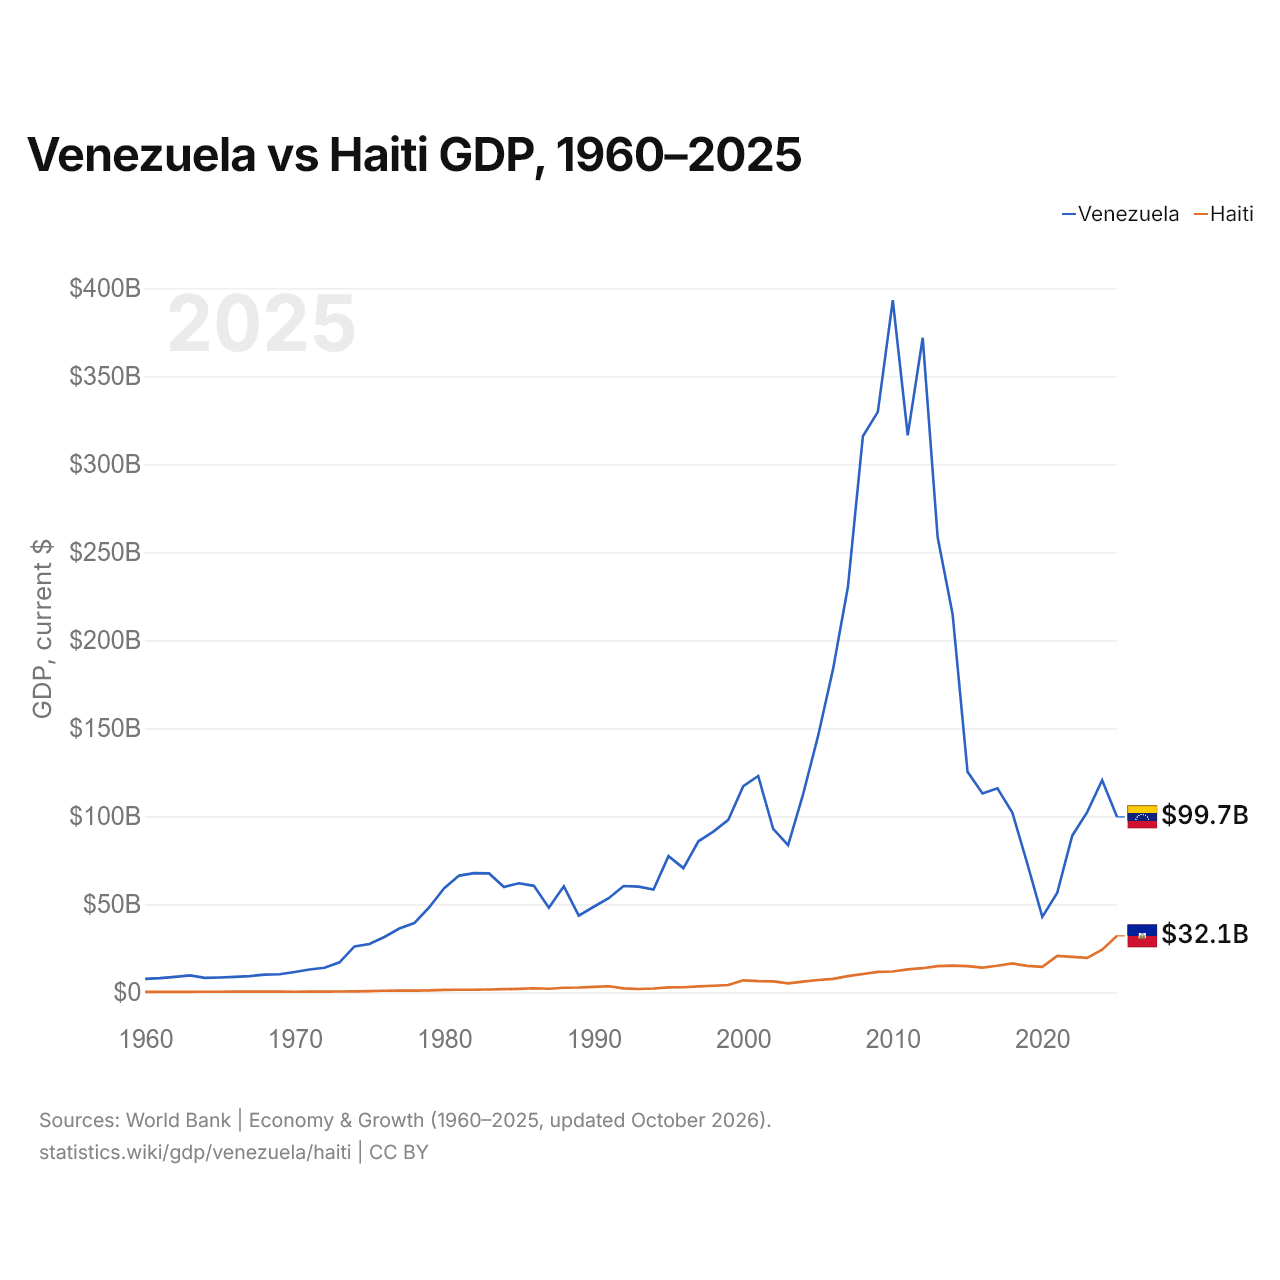
En 2025, el PIB de Venezuela (99,7 mil millones de US$) fue 3,1 veces el de Haití (32,1 mil millones de US$). En 2015 era 8,4 veces. De 2015 a 2025, a precios constantes de 2015, el PIB de Venezuela cayó un 65,4 % y el de Haití, un 10,9 %.
Desde 1960, el PIB de Venezuela ha sido cada año el mayor de los dos; en 1960, era 28 veces el de Haití. En 2025, el PIB per cápita fue de 3495 US$ en Venezuela y de 2694 US$ en Haití: un 30 % más alto en Venezuela.
Venezuela vs Haití: últimos datos del PIB
|
Venezuela
|
Haití
|
|
|---|---|---|
| PIB, US$ corrientes | 99,7 mil M US$ | 32,1 mil M US$ |
| Puesto mundial | 78/197 | 112/197 |
| Porcentaje del mundo | 0,08 % | 0,03 % |
| PIB, US$ constantes de 2015 | 43,3 mil M US$ | 13,2 mil M US$ |
| Diferencia de PIB | 3,1× | 0,32× |
Comparar el PIB de 2 países cualesquiera
Fuentes:
- Banco Mundial | Economía y crecimiento (1960–2025, actualizado en octubre de 2026)
Creative Commons Atribución (CC BY): puedes copiar, compartir, adaptar y reutilizar este contenido, también con fines comerciales, siempre que cites a statistics.wiki e indiques los cambios que hayas hecho. Las fuentes indicadas arriba pueden tener sus propias condiciones de licencia.