
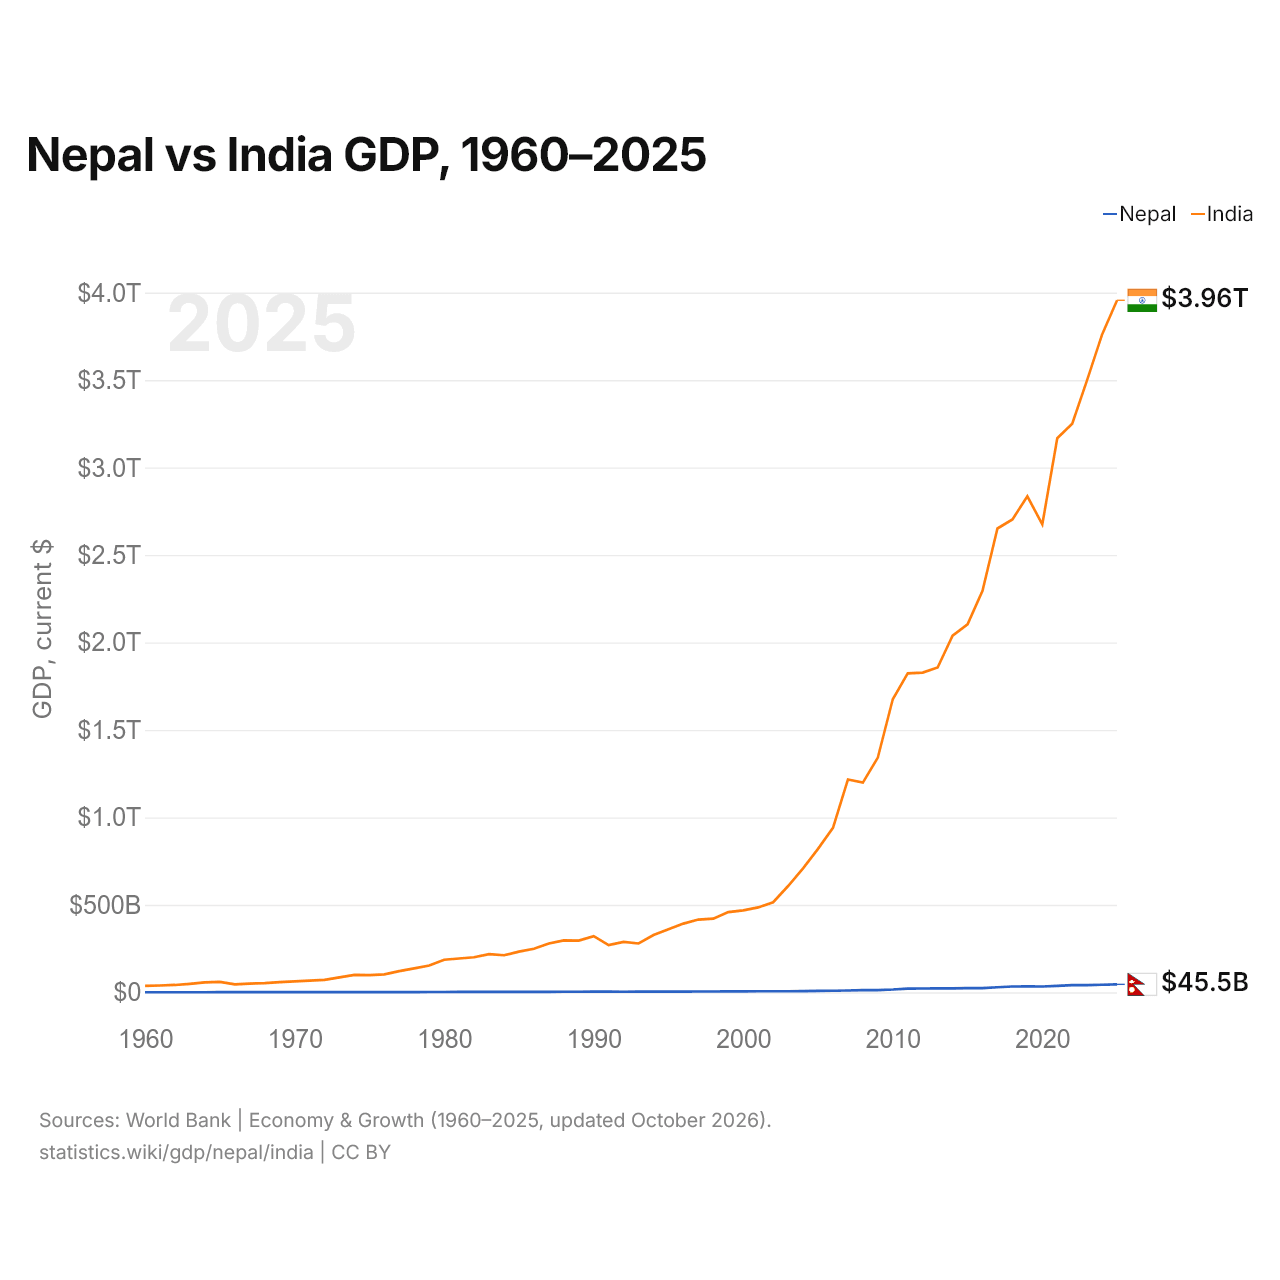
Nepal vs India: PIB, 1960–2025
| Año | PIB, US$ corrientes | |
|---|---|---|
 Nepal |
 India |
|
| 2025 | 45.489.810.283 US$ | 3.956.067.115.772 US$ |
| 2024 | 43.298.911.700 US$ | 3.760.813.470.501 US$ |
| 2023 | 41.049.329.851 US$ | 3.500.906.030.645 US$ |
| 2022 | 41.182.939.520 US$ | 3.249.938.492.013 US$ |
| 2021 | 36.924.841.394 US$ | 3.167.270.623.260 US$ |
| 2020 | 33.433.659.301 US$ | 2.674.851.578.587 US$ |
| 2019 | 34.186.180.699 US$ | 2.835.606.256.558 US$ |
| 2018 | 33.111.525.237 US$ | 2.702.929.641.649 US$ |
| 2017 | 28.971.588.940 US$ | 2.651.474.262.755 US$ |
| 2016 | 24.524.109.484 US$ | 2.294.796.885.663 US$ |
| 2015 | 24.360.801.287 US$ | 2.103.588.360.045 US$ |
| 2014 | 22.731.612.922 US$ | 2.039.126.479.155 US$ |
| 2013 | 22.162.204.925 US$ | 1.856.721.507.622 US$ |
| 2012 | 21.703.100.877 US$ | 1.827.637.590.410 US$ |
| 2011 | 21.573.872.421 US$ | 1.823.051.829.895 US$ |
| 2010 | 16.002.656.434 US$ | 1.675.615.519.485 US$ |
| 2009 | 12.854.985.464 US$ | 1.341.888.016.995 US$ |
| 2008 | 12.545.438.605 US$ | 1.198.895.139.006 US$ |
| 2007 | 10.325.618.017 US$ | 1.216.736.438.835 US$ |
| 2006 | 9.043.715.356 US$ | 940.259.888.788 US$ |
| 2005 | 8.130.258.378 US$ | 820.383.763.511 US$ |
| 2004 | 7.273.938.315 US$ | 709.152.728.831 US$ |
| 2003 | 6.330.473.097 US$ | 607.700.687.237 US$ |
| 2002 | 6.050.875.807 US$ | 514.939.140.319 US$ |
| 2001 | 6.007.055.042 US$ | 485.440.139.204 US$ |
| 2000 | 5.494.252.208 US$ | 468.395.521.654 US$ |
| 1999 | 5.033.642.384 US$ | 458.821.052.616 US$ |
| 1998 | 4.856.255.044 US$ | 421.351.317.225 US$ |
| 1997 | 4.918.691.917 US$ | 415.867.563.593 US$ |
| 1996 | 4.521.580.381 US$ | 392.896.866.205 US$ |
| 1995 | 4.401.104.418 US$ | 360.281.909.643 US$ |
| 1994 | 4.066.775.510 US$ | 327.274.843.459 US$ |
| 1993 | 3.660.041.667 US$ | 279.295.648.983 US$ |
| 1992 | 3.401.211.581 US$ | 288.208.070.278 US$ |
| 1991 | 3.921.476.085 US$ | 270.105.341.879 US$ |
| 1990 | 3.627.560.239 US$ | 320.979.026.420 US$ |
| 1989 | 3.525.225.787 US$ | 296.042.052.945 US$ |
| 1988 | 3.487.009.748 US$ | 296.589.670.896 US$ |
| 1987 | 2.957.255.380 US$ | 279.033.584.092 US$ |
| 1986 | 2.850.782.044 US$ | 248.985.994.041 US$ |
| 1985 | 2.619.913.956 US$ | 232.511.554.840 US$ |
| 1984 | 2.581.207.388 US$ | 212.157.645.178 US$ |
| 1983 | 2.447.174.803 US$ | 218.262.146.413 US$ |
| 1982 | 2.395.423.742 US$ | 200.715.624.831 US$ |
| 1981 | 2.275.583.317 US$ | 193.491.368.446 US$ |
| 1980 | 1.945.916.583 US$ | 186.328.579.302 US$ |
| 1979 | 1.851.250.008 US$ | 152.995.442.498 US$ |
| 1978 | 1.604.162.497 US$ | 137.302.319.829 US$ |
| 1977 | 1.382.400.000 US$ | 121.486.641.441 US$ |
| 1976 | 1.452.788.985 US$ | 102.716.451.980 US$ |
| 1975 | 1.575.789.254 US$ | 98.473.832.017 US$ |
| 1974 | 1.217.953.547 US$ | 99.526.597.934 US$ |
| 1973 | 972.101.725 US$ | 85.517.673.173 US$ |
| 1972 | 1.024.098.400 US$ | 71.464.700.667 US$ |
| 1971 | 882.765.472 US$ | 67.351.404.352 US$ |
| 1970 | 865.975.309 US$ | 62.422.483.055 US$ |
| 1969 | 788.641.965 US$ | 58.447.995.017 US$ |
| 1968 | 772.231.387 US$ | 53.085.455.871 US$ |
| 1967 | 841.974.025 US$ | 50.134.942.204 US$ |
| 1966 | 906.811.944 US$ | 45.581.230.504 US$ |
| 1965 | 735.267.082 US$ | 59.556.105.229 US$ |
| 1964 | 496.098.775 US$ | 56.480.289.941 US$ |
| 1963 | 496.947.904 US$ | 48.421.923.459 US$ |
| 1962 | 574.091.101 US$ | 42.161.481.858 US$ |
| 1961 | 531.959.562 US$ | 39.232.435.784 US$ |
| 1960 | 508.334.414 US$ | 37.029.883.876 US$ |
En 2025, el PIB de la India (3,96 billones de US$) fue 87 veces el de Nepal (45,5 mil millones de US$). En 2015 era 86 veces. De 2015 a 2025, a precios constantes de 2015, el PIB de la India creció un 75,6 % y el de Nepal, un 50,0 %.
Desde 1960, el PIB de la India ha sido cada año el mayor de los dos; en 1960, era 73 veces el de Nepal. En 2025, el PIB per cápita fue de 1536 US$ en Nepal y de 2702 US$ en la India: 1,8 veces más alto en la India.
Nepal vs India: últimos datos del PIB
|
Nepal
|
India
|
|
|---|---|---|
| PIB, US$ corrientes | 45,5 mil M US$ | 3,96 B US$ |
| Puesto mundial | 102/197 | 6/197 |
| Porcentaje del mundo | 0,04 % | 3,34 % |
| PIB, US$ constantes de 2015 | 36,5 mil M US$ | 3,69 B US$ |
| Diferencia de PIB | 0,011× | 87× |
Comparar el PIB de 2 países cualesquiera
Fuentes:
- Banco Mundial | Economía y crecimiento (1960–2025, actualizado en octubre de 2026)
Creative Commons Atribución (CC BY): puedes copiar, compartir, adaptar y reutilizar este contenido, también con fines comerciales, siempre que cites a statistics.wiki e indiques los cambios que hayas hecho. Las fuentes indicadas arriba pueden tener sus propias condiciones de licencia.