
Irán vs India: PIB, 1960–2025
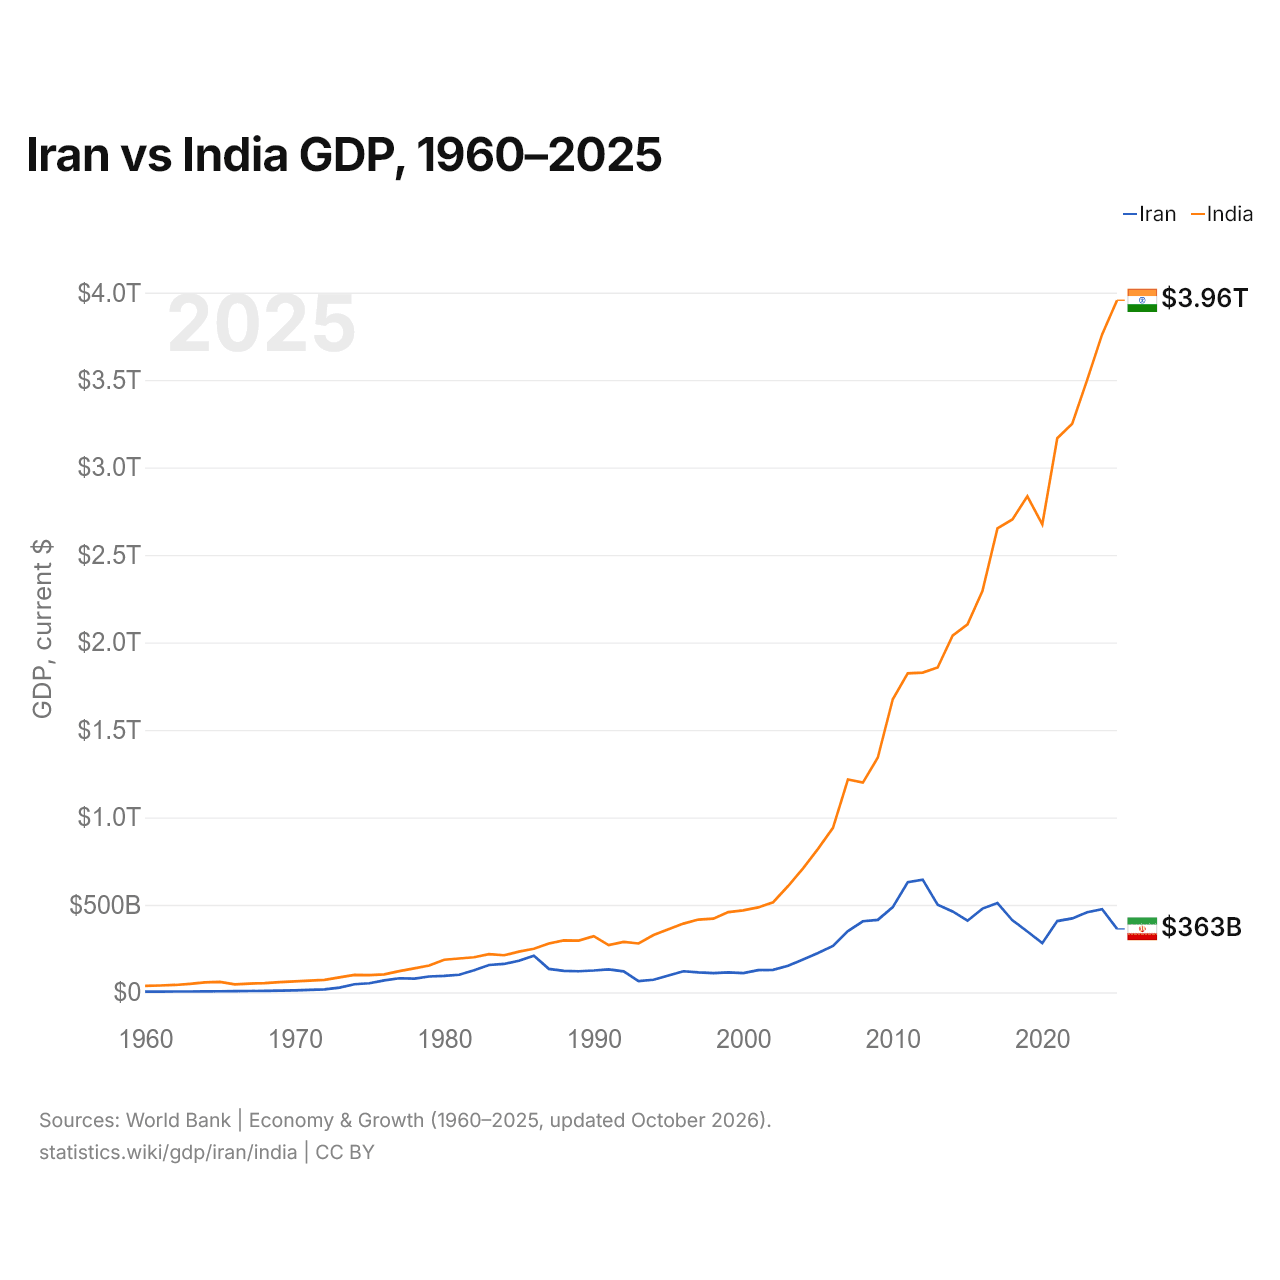
| Año | PIB, US$ corrientes | |
|---|---|---|
 Irán |
 India |
|
| 2025 | 362.682.115.433 US$ | 3.956.067.115.772 US$ |
| 2024 | 475.252.089.215 US$ | 3.760.813.470.501 US$ |
| 2023 | 457.510.482.317 US$ | 3.500.906.030.645 US$ |
| 2022 | 422.662.261.526 US$ | 3.249.938.492.013 US$ |
| 2021 | 407.350.685.583 US$ | 3.167.270.623.260 US$ |
| 2020 | 280.934.329.280 US$ | 2.674.851.578.587 US$ |
| 2019 | 347.988.400.958 US$ | 2.835.606.256.558 US$ |
| 2018 | 411.903.303.606 US$ | 2.702.929.641.649 US$ |
| 2017 | 510.239.893.418 US$ | 2.651.474.262.755 US$ |
| 2016 | 478.618.064.871 US$ | 2.294.796.885.663 US$ |
| 2015 | 409.191.686.497 US$ | 2.103.588.360.045 US$ |
| 2014 | 462.284.793.281 US$ | 2.039.126.479.155 US$ |
| 2013 | 500.399.839.840 US$ | 1.856.721.507.622 US$ |
| 2012 | 644.019.315.004 US$ | 1.827.637.590.410 US$ |
| 2011 | 629.082.257.472 US$ | 1.823.051.829.895 US$ |
| 2010 | 487.069.570.464 US$ | 1.675.615.519.485 US$ |
| 2009 | 414.059.094.949 US$ | 1.341.888.016.995 US$ |
| 2008 | 406.070.949.554 US$ | 1.198.895.139.006 US$ |
| 2007 | 349.736.591.832 US$ | 1.216.736.438.835 US$ |
| 2006 | 265.602.187.404 US$ | 940.259.888.788 US$ |
| 2005 | 224.970.371.325 US$ | 820.383.763.511 US$ |
| 2004 | 187.754.571.248 US$ | 709.152.728.831 US$ |
| 2003 | 151.911.222.119 US$ | 607.700.687.237 US$ |
| 2002 | 128.626.917.504 US$ | 514.939.140.319 US$ |
| 2001 | 126.878.750.296 US$ | 485.440.139.204 US$ |
| 2000 | 109.591.707.802 US$ | 468.395.521.654 US$ |
| 1999 | 113.848.450.088 US$ | 458.821.052.616 US$ |
| 1998 | 110.276.913.363 US$ | 421.351.317.225 US$ |
| 1997 | 113.919.163.421 US$ | 415.867.563.593 US$ |
| 1996 | 120.403.931.885 US$ | 392.896.866.205 US$ |
| 1995 | 96.419.225.744 US$ | 360.281.909.643 US$ |
| 1994 | 71.841.461.173 US$ | 327.274.843.459 US$ |
| 1993 | 63.743.623.232 US$ | 279.295.648.983 US$ |
| 1992 | 119.768.691.217 US$ | 288.208.070.278 US$ |
| 1991 | 131.637.664.958 US$ | 270.105.341.879 US$ |
| 1990 | 124.813.263.926 US$ | 320.979.026.420 US$ |
| 1989 | 120.496.362.916 US$ | 296.042.052.945 US$ |
| 1988 | 123.057.861.334 US$ | 296.589.670.896 US$ |
| 1987 | 134.009.995.923 US$ | 279.033.584.092 US$ |
| 1986 | 209.094.561.833 US$ | 248.985.994.041 US$ |
| 1985 | 180.183.629.600 US$ | 232.511.554.840 US$ |
| 1984 | 162.276.728.620 US$ | 212.157.645.178 US$ |
| 1983 | 156.365.156.618 US$ | 218.262.146.413 US$ |
| 1982 | 125.948.756.439 US$ | 200.715.624.831 US$ |
| 1981 | 100.499.312.750 US$ | 193.491.368.446 US$ |
| 1980 | 94.362.275.580 US$ | 186.328.579.302 US$ |
| 1979 | 90.391.877.326 US$ | 152.995.442.498 US$ |
| 1978 | 77.994.316.621 US$ | 137.302.319.829 US$ |
| 1977 | 80.600.122.702 US$ | 121.486.641.441 US$ |
| 1976 | 68.055.295.081 US$ | 102.716.451.980 US$ |
| 1975 | 51.776.222.350 US$ | 98.473.832.017 US$ |
| 1974 | 46.209.092.072 US$ | 99.526.597.934 US$ |
| 1973 | 27.081.698.250 US$ | 85.517.673.173 US$ |
| 1972 | 17.153.463.263 US$ | 71.464.700.667 US$ |
| 1971 | 13.731.802.833 US$ | 67.351.404.352 US$ |
| 1970 | 10.976.245.154 US$ | 62.422.483.055 US$ |
| 1969 | 9.743.089.607 US$ | 58.447.995.017 US$ |
| 1968 | 8.623.172.960 US$ | 53.085.455.871 US$ |
| 1967 | 7.555.383.690 US$ | 50.134.942.204 US$ |
| 1966 | 6.789.938.672 US$ | 45.581.230.504 US$ |
| 1965 | 6.197.319.929 US$ | 59.556.105.229 US$ |
| 1964 | 5.379.845.648 US$ | 56.480.289.941 US$ |
| 1963 | 4.928.628.018 US$ | 48.421.923.459 US$ |
| 1962 | 4.693.566.416 US$ | 42.161.481.858 US$ |
| 1961 | 4.426.949.095 US$ | 39.232.435.784 US$ |
| 1960 | 4.199.134.390 US$ | 37.029.883.876 US$ |
En 2025, el PIB de la India (3,96 billones de US$) fue 11 veces el de Irán (363 mil millones de US$). En 2015 era 5,1 veces. De 2015 a 2025, a precios constantes de 2015, el PIB de la India creció un 75,6 % y el de Irán, un 26,9 %.
Desde 1960, el PIB de la India ha sido cada año el mayor de los dos; en 1960, era 8,8 veces el de Irán. En 2025, el PIB per cápita fue de 3924 US$ en Irán y de 2702 US$ en la India: un 45 % más alto en Irán.
Irán vs India: últimos datos del PIB
|
Irán
|
India
|
|
|---|---|---|
| PIB, US$ corrientes | 363 mil M US$ | 3,96 B US$ |
| Puesto mundial | 44/197 | 6/197 |
| Porcentaje del mundo | 0,31 % | 3,34 % |
| PIB, US$ constantes de 2015 | 519 mil M US$ | 3,69 B US$ |
| Diferencia de PIB | 0,092× | 11× |
Comparar el PIB de 2 países cualesquiera
Fuentes:
- Banco Mundial | Economía y crecimiento (1960–2025, actualizado en octubre de 2026)
Creative Commons Atribución (CC BY): puedes copiar, compartir, adaptar y reutilizar este contenido, también con fines comerciales, siempre que cites a statistics.wiki e indiques los cambios que hayas hecho. Las fuentes indicadas arriba pueden tener sus propias condiciones de licencia.