
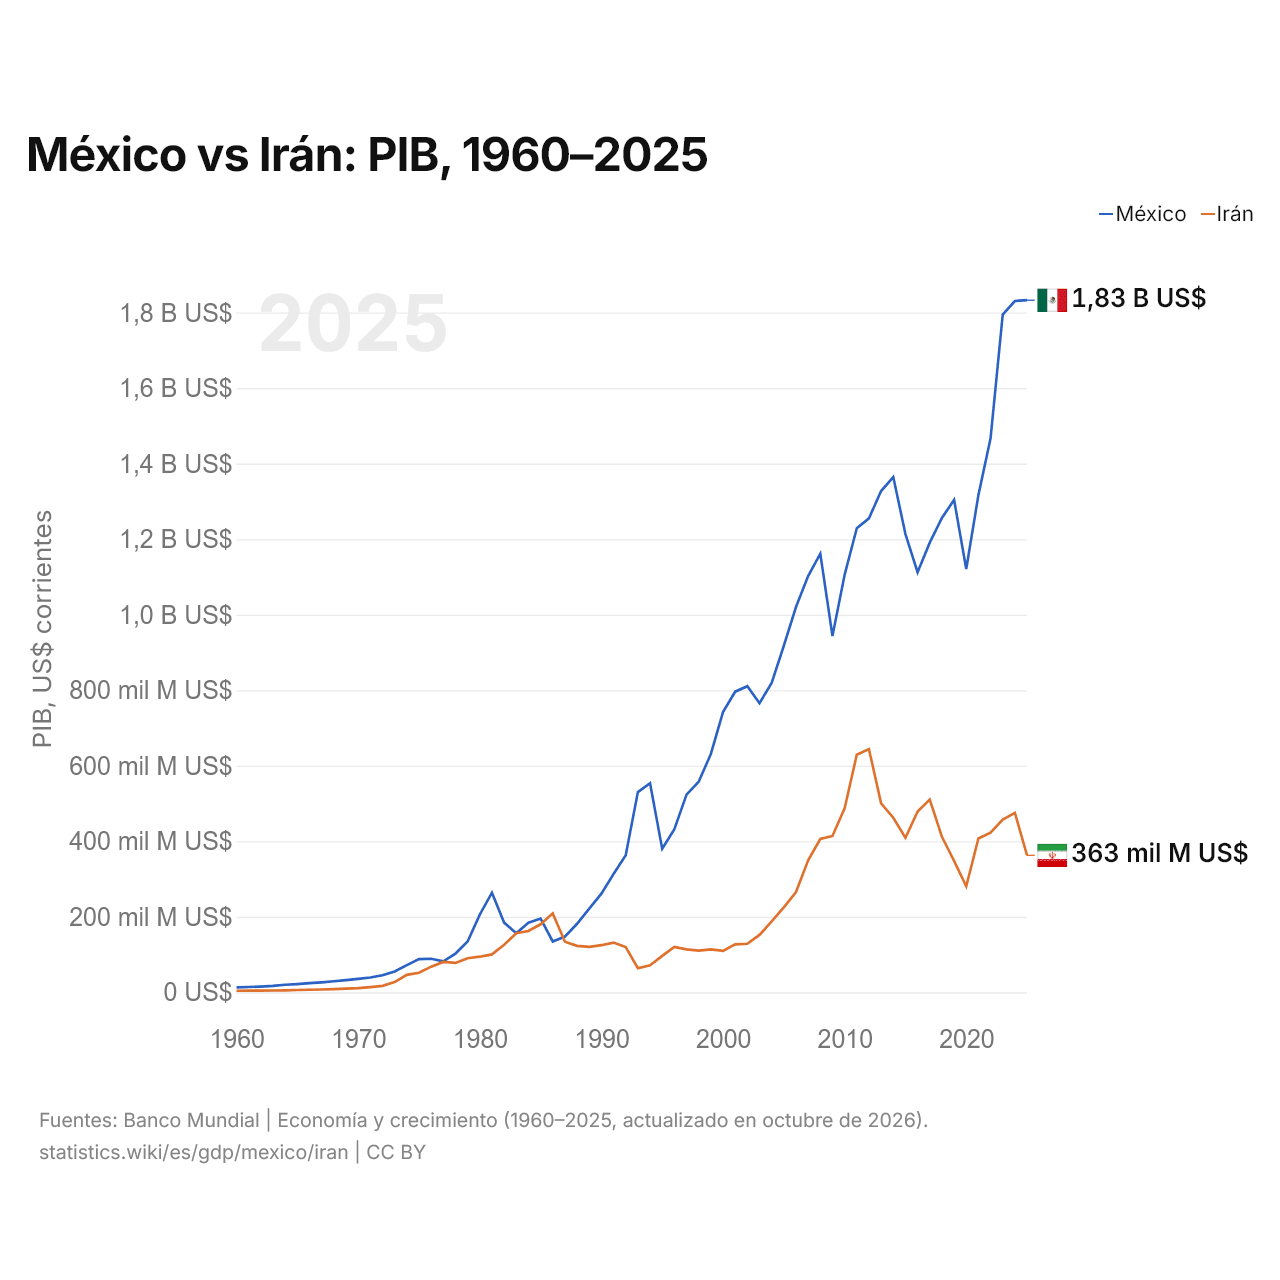
México vs Irán: PIB, 1960–2025
| Año | PIB, US$ corrientes | |
|---|---|---|
 México |
 Irán |
|
| 2025 | 1.832.641.364.776 US$ | 362.682.115.433 US$ |
| 2024 | 1.830.489.311.089 US$ | 475.252.089.215 US$ |
| 2023 | 1.794.410.347.718 US$ | 457.510.482.317 US$ |
| 2022 | 1.466.934.724.243 US$ | 422.662.261.526 US$ |
| 2021 | 1.316.569.466.834 US$ | 407.350.685.583 US$ |
| 2020 | 1.121.064.767.169 US$ | 280.934.329.280 US$ |
| 2019 | 1.304.106.204.006 US$ | 347.988.400.958 US$ |
| 2018 | 1.256.300.182.984 US$ | 411.903.303.606 US$ |
| 2017 | 1.190.721.475.853 US$ | 510.239.893.418 US$ |
| 2016 | 1.112.233.497.453 US$ | 478.618.064.871 US$ |
| 2015 | 1.213.294.467.654 US$ | 409.191.686.497 US$ |
| 2014 | 1.364.507.717.689 US$ | 462.284.793.281 US$ |
| 2013 | 1.327.436.290.439 US$ | 500.399.839.840 US$ |
| 2012 | 1.255.110.424.742 US$ | 644.019.315.004 US$ |
| 2011 | 1.229.013.703.417 US$ | 629.082.257.472 US$ |
| 2010 | 1.105.424.238.652 US$ | 487.069.570.464 US$ |
| 2009 | 943.437.414.951 US$ | 414.059.094.949 US$ |
| 2008 | 1.161.553.459.985 US$ | 406.070.949.554 US$ |
| 2007 | 1.102.355.554.880 US$ | 349.736.591.832 US$ |
| 2006 | 1.020.265.057.882 US$ | 265.602.187.404 US$ |
| 2005 | 917.571.853.437 US$ | 224.970.371.325 US$ |
| 2004 | 819.459.227.375 US$ | 187.754.571.248 US$ |
| 2003 | 765.549.967.889 US$ | 151.911.222.119 US$ |
| 2002 | 810.666.116.402 US$ | 128.626.917.504 US$ |
| 2001 | 796.064.590.549 US$ | 126.878.750.296 US$ |
| 2000 | 742.061.329.749 US$ | 109.591.707.802 US$ |
| 1999 | 631.249.359.702 US$ | 113.848.450.088 US$ |
| 1998 | 557.461.102.631 US$ | 110.276.913.363 US$ |
| 1997 | 523.449.530.464 US$ | 113.919.163.421 US$ |
| 1996 | 432.157.945.024 US$ | 120.403.931.885 US$ |
| 1995 | 380.157.469.867 US$ | 96.419.225.744 US$ |
| 1994 | 553.618.247.901 US$ | 71.841.461.173 US$ |
| 1993 | 530.160.763.663 US$ | 63.743.623.232 US$ |
| 1992 | 363.157.832.924 US$ | 119.768.691.217 US$ |
| 1991 | 313.139.656.146 US$ | 131.637.664.958 US$ |
| 1990 | 261.253.675.693 US$ | 124.813.263.926 US$ |
| 1989 | 221.403.098.267 US$ | 120.496.362.916 US$ |
| 1988 | 181.611.150.497 US$ | 123.057.861.334 US$ |
| 1987 | 147.542.558.209 US$ | 134.009.995.923 US$ |
| 1986 | 134.556.034.673 US$ | 209.094.561.833 US$ |
| 1985 | 195.241.069.482 US$ | 180.183.629.600 US$ |
| 1984 | 184.230.754.105 US$ | 162.276.728.620 US$ |
| 1983 | 156.167.000.433 US$ | 156.365.156.618 US$ |
| 1982 | 184.602.611.610 US$ | 125.948.756.439 US$ |
| 1981 | 263.797.827.860 US$ | 100.499.312.750 US$ |
| 1980 | 205.577.055.466 US$ | 94.362.275.580 US$ |
| 1979 | 134.531.900.899 US$ | 90.391.877.326 US$ |
| 1978 | 102.648.570.299 US$ | 77.994.316.621 US$ |
| 1977 | 81.912.018.784 US$ | 80.600.122.702 US$ |
| 1976 | 88.875.923.765 US$ | 68.055.295.081 US$ |
| 1975 | 88.000.000.000 US$ | 51.776.222.350 US$ |
| 1974 | 72.000.000.000 US$ | 46.209.092.072 US$ |
| 1973 | 55.280.000.000 US$ | 27.081.698.250 US$ |
| 1972 | 45.200.000.000 US$ | 17.153.463.263 US$ |
| 1971 | 39.200.000.000 US$ | 13.731.802.833 US$ |
| 1970 | 35.520.000.000 US$ | 10.976.245.154 US$ |
| 1969 | 32.480.000.000 US$ | 9.743.089.607 US$ |
| 1968 | 29.360.000.000 US$ | 8.623.172.960 US$ |
| 1967 | 26.560.000.000 US$ | 7.555.383.690 US$ |
| 1966 | 24.320.000.000 US$ | 6.789.938.672 US$ |
| 1965 | 21.840.000.000 US$ | 6.197.319.929 US$ |
| 1964 | 20.080.000.000 US$ | 5.379.845.648 US$ |
| 1963 | 16.960.000.000 US$ | 4.928.628.018 US$ |
| 1962 | 15.200.000.000 US$ | 4.693.566.416 US$ |
| 1961 | 14.160.000.000 US$ | 4.426.949.095 US$ |
| 1960 | 13.040.000.000 US$ | 4.199.134.390 US$ |
En 2025, el PIB de México (1,83 billones de US$) fue 5,1 veces el de Irán (363 mil millones de US$). En 2015 era 3,0 veces. De 2015 a 2025, a precios constantes de 2015, el PIB de México creció un 11,5 % y el de Irán, un 26,9 %.
Desde 1987, el PIB de México es el mayor de los dos; también lo era en 1960, cuando era 3,1 veces el de Irán. En 2025, el PIB per cápita fue de 13.889 US$ en México y de 3924 US$ en Irán: 3,5 veces más alto en México.
México vs Irán: últimos datos del PIB
|
México
|
Irán
|
|
|---|---|---|
| PIB, US$ corrientes | 1,83 B US$ | 363 mil M US$ |
| Puesto mundial | 14/197 | 44/197 |
| Porcentaje del mundo | 1,55 % | 0,31 % |
| PIB, US$ constantes de 2015 | 1,35 B US$ | 519 mil M US$ |
| Diferencia de PIB | 5,1× | 0,2× |
Comparar el PIB de 2 países cualesquiera
Fuentes:
- Banco Mundial | Economía y crecimiento (1960–2025, actualizado en octubre de 2026)
Creative Commons Atribución (CC BY): puedes copiar, compartir, adaptar y reutilizar este contenido, también con fines comerciales, siempre que cites a statistics.wiki e indiques los cambios que hayas hecho. Las fuentes indicadas arriba pueden tener sus propias condiciones de licencia.